Having Fun Visualising the Billboard Hot 100
Having Fun Visualising the Billboard Hot 100
Year
Year
2018
2018
Teammates
Teammates
Allison Wong
Allison Wong
My role
My role
Data Analysis, Visualisation Design & Development
Data Analysis, Visualisation Design & Development
Tools
Tools
R, d3.js, HTML, CSS
R, d3.js, HTML, CSS
Introduction
Introduction
During my final semester in university, I embarked on an exciting data visualisation project in collaboration with a fellow music enthusiast. Our goal was to have fun exploring 25 years of the iconic Billboard Hot 100 chart, identifying trends and observing the evolution of music and lyrics over time.
During my final semester in university, I embarked on an exciting data visualisation project in collaboration with a fellow music enthusiast. Our goal was to have fun exploring 25 years of the iconic Billboard Hot 100 chart, identifying trends and observing the evolution of music and lyrics over time.
Process
Process
01
01
Extract & Transform Chart and Lyric Data
Extract & Transform Data
02
02
Explore Data and Investigate Trends
Explore Data and Investigate Trends
03
03
Conceptualise Visualisations
Conceptualise Visualisations
04
04
Develop Web Interface and Interactive Visualisations
Develop Interface and Visualisations
Visualisations
Visualisations
Who were the hottest artists?
Who were the hottest artists?
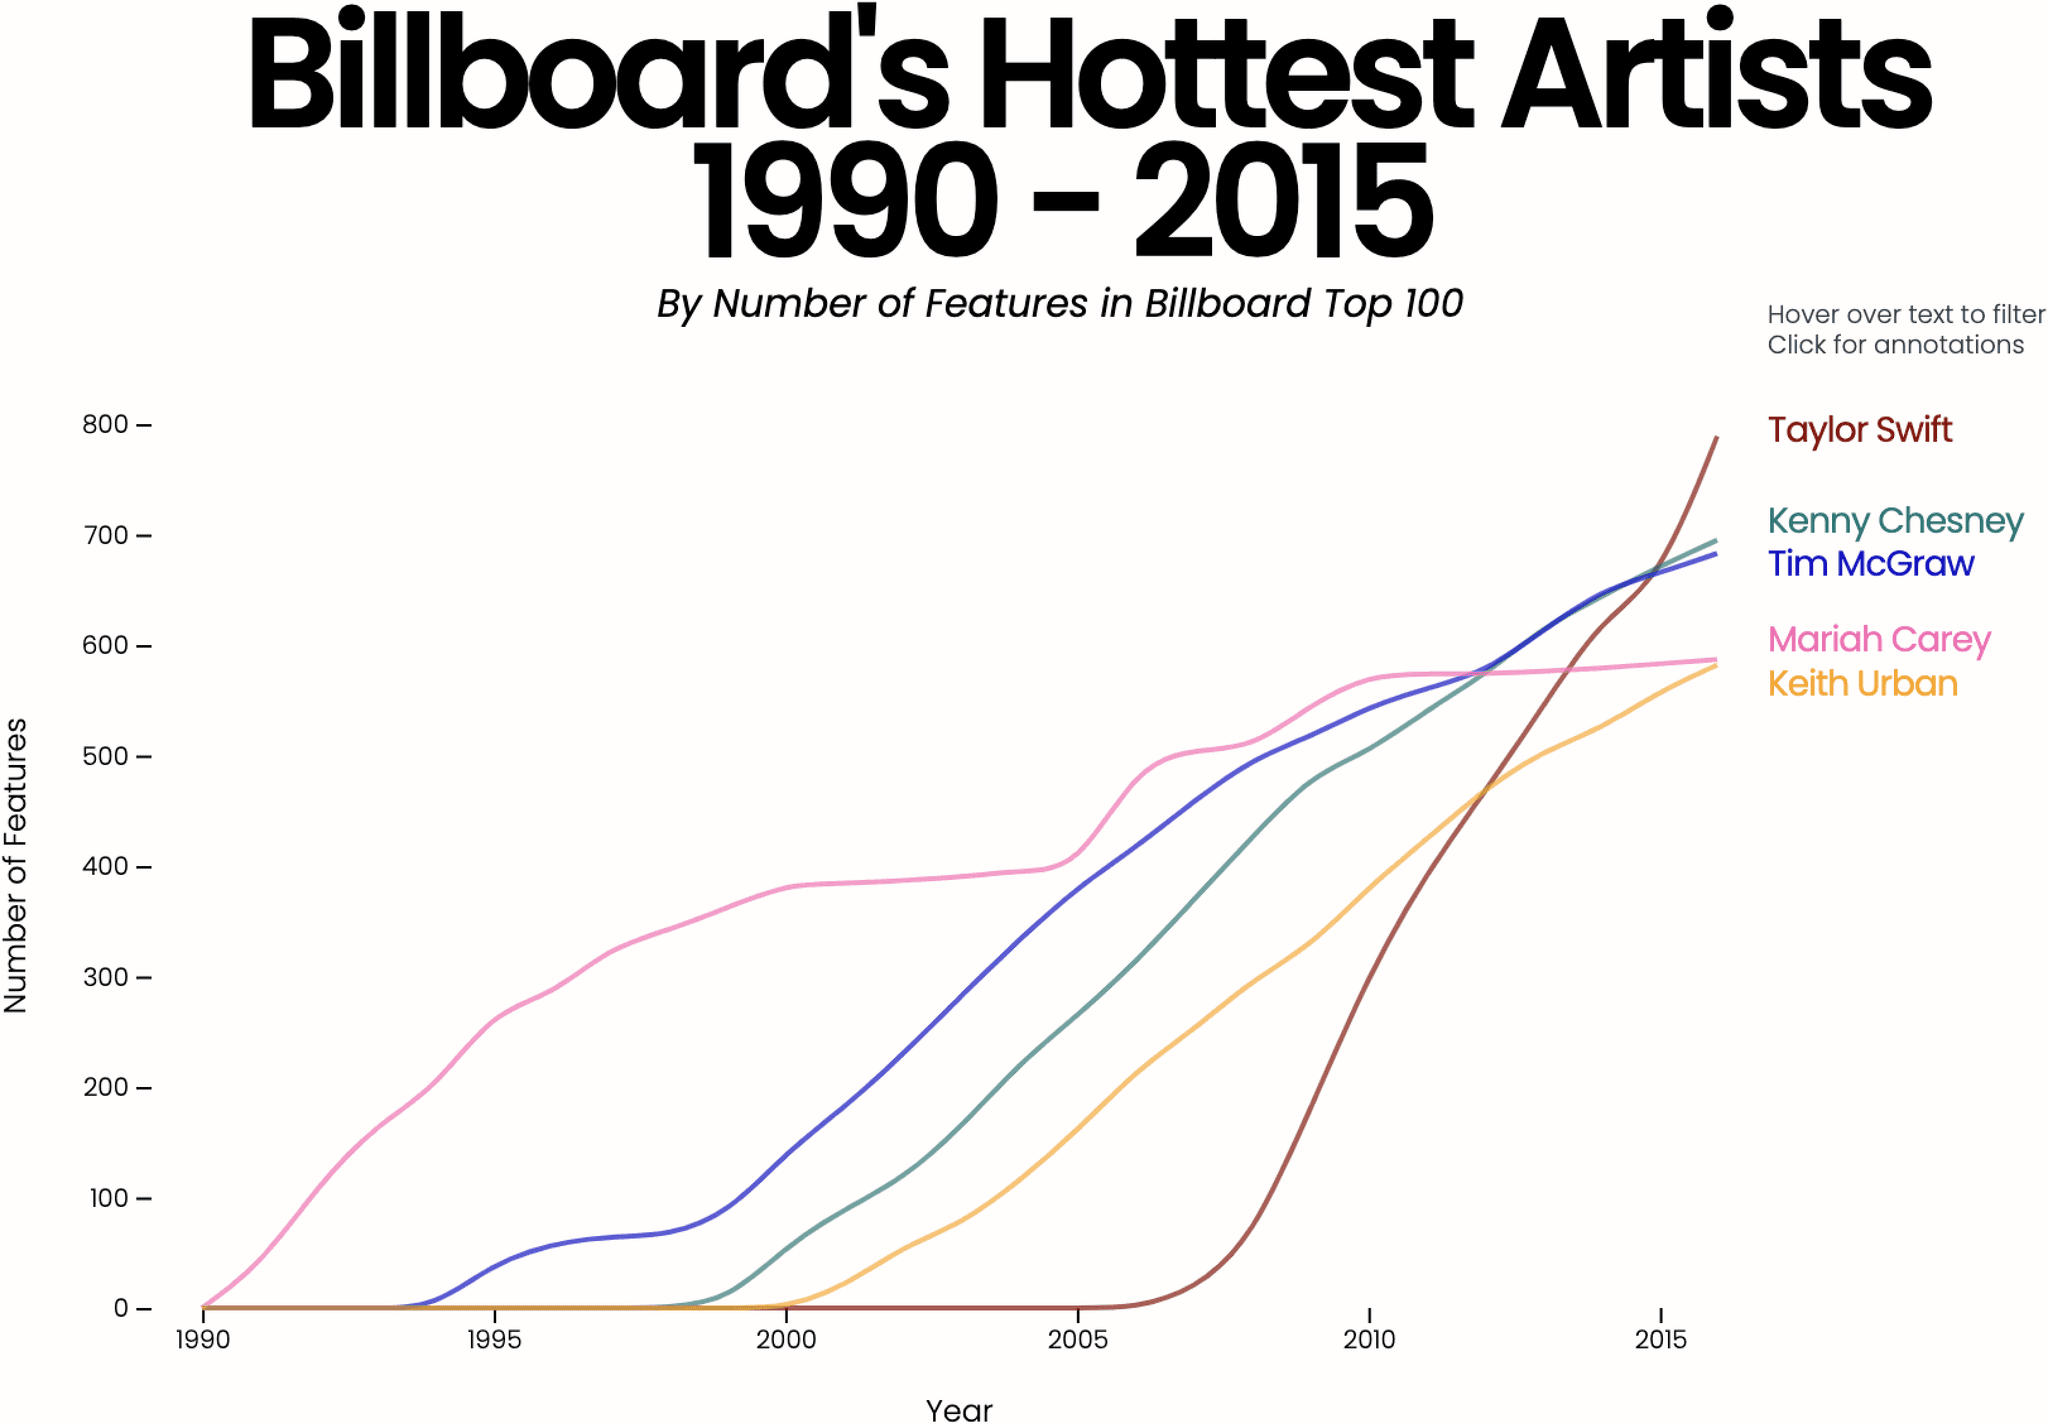
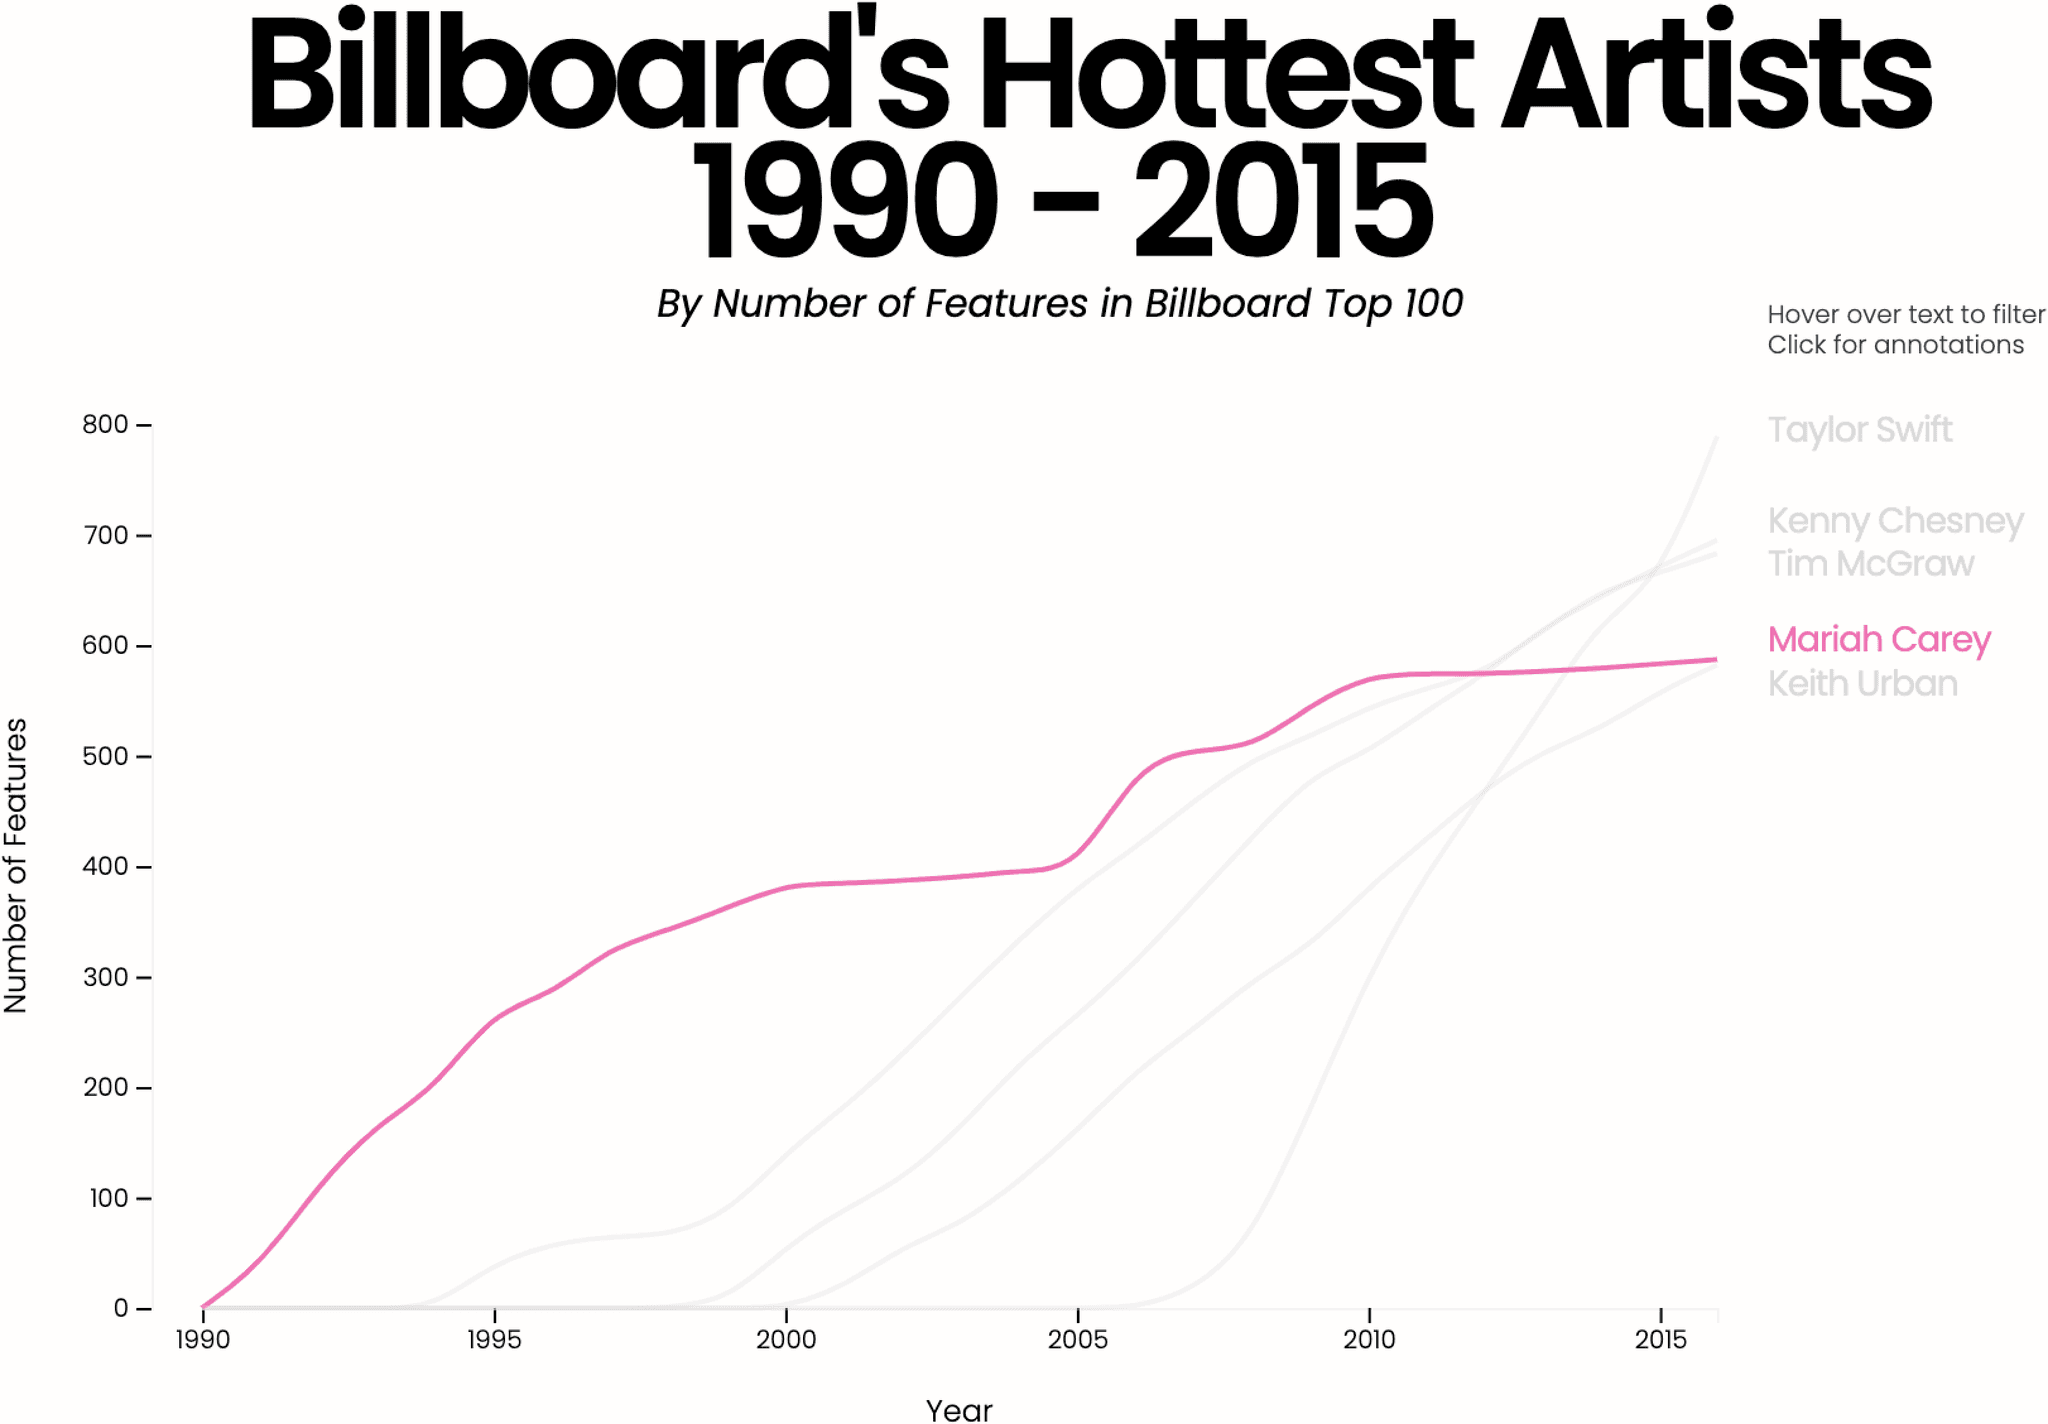
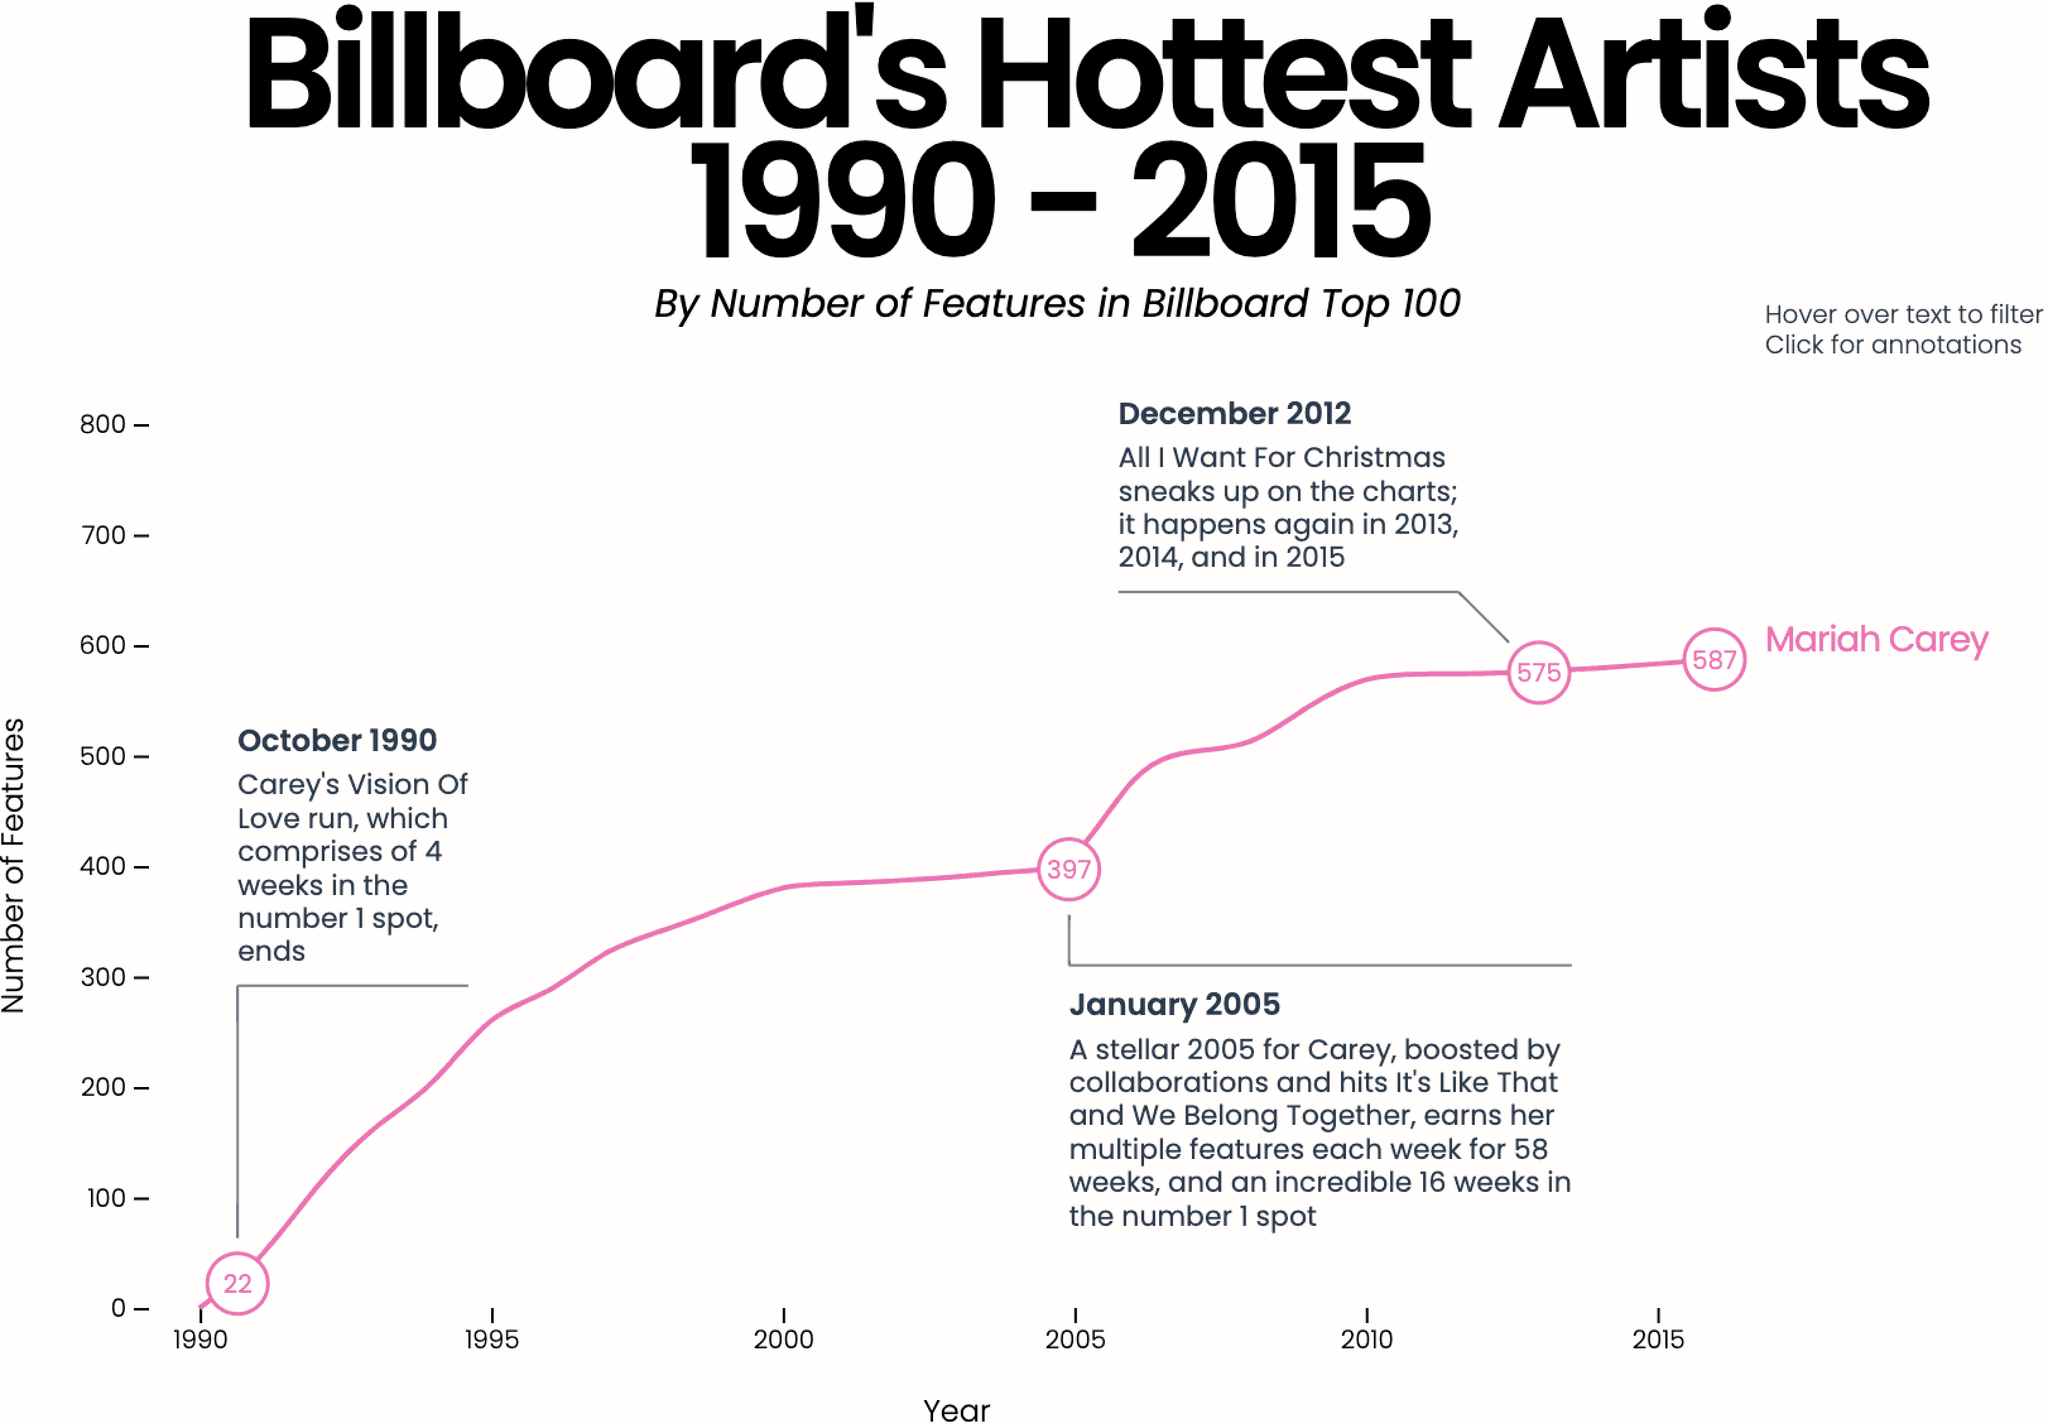
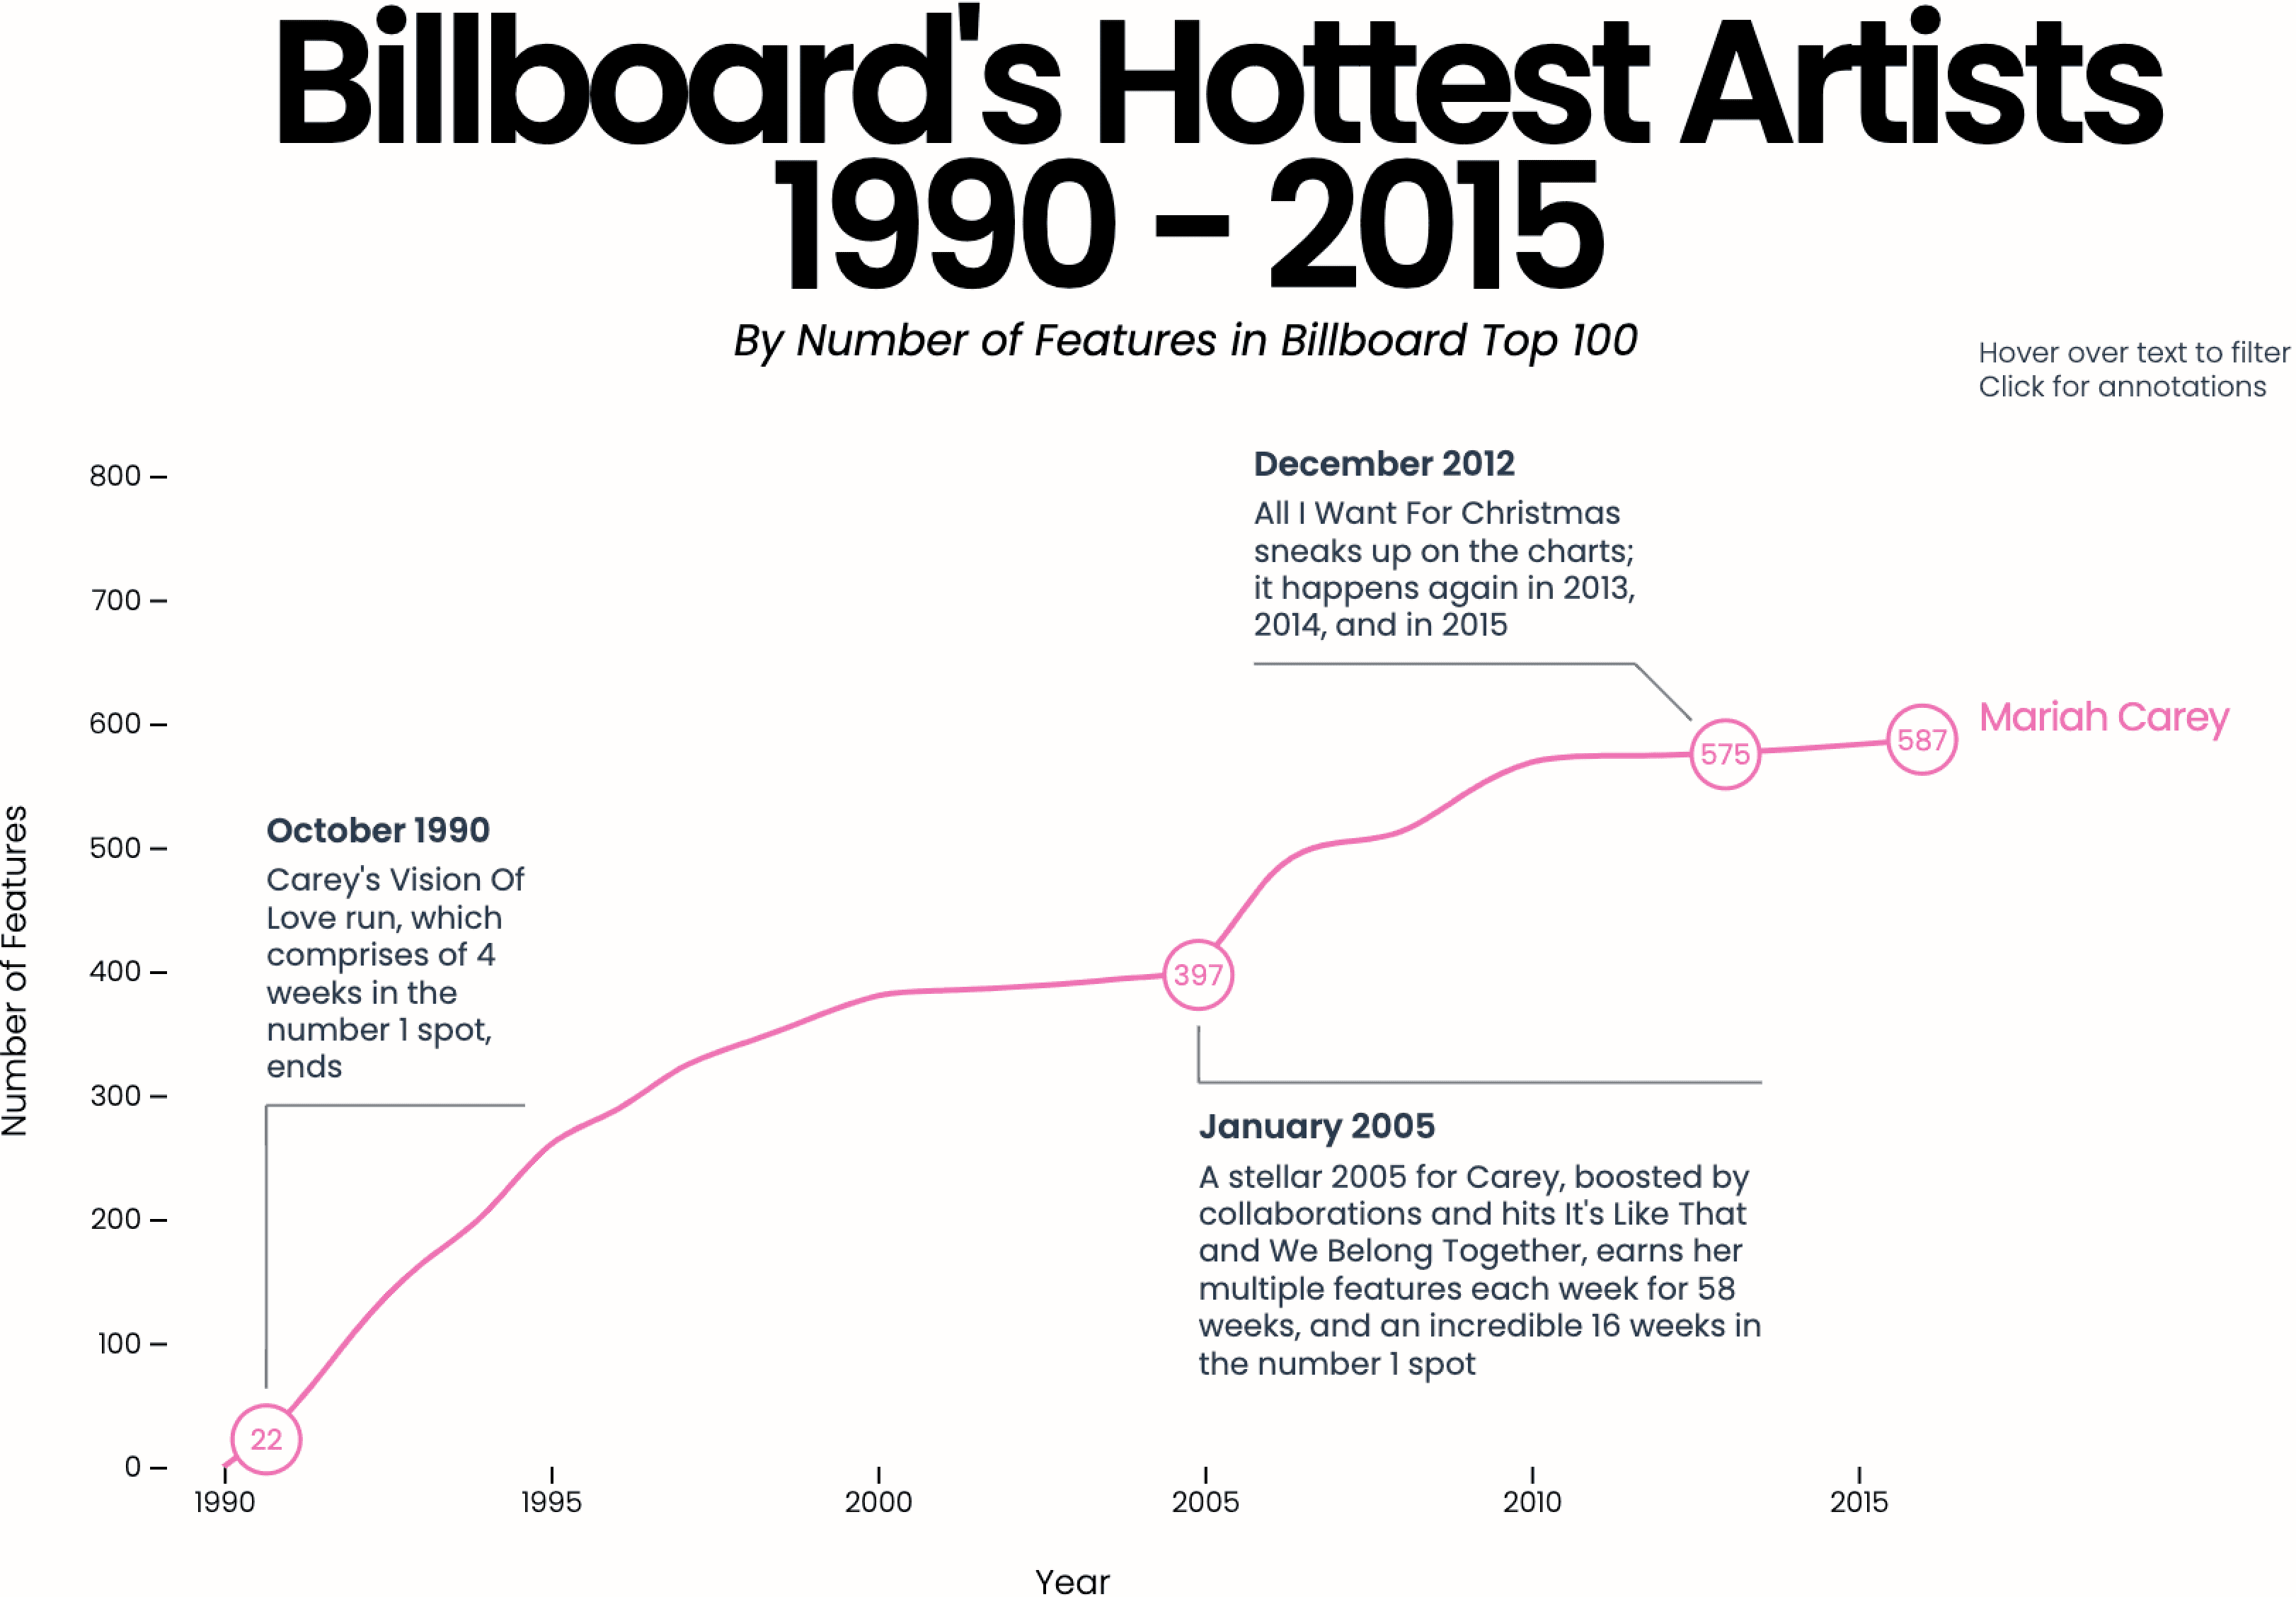
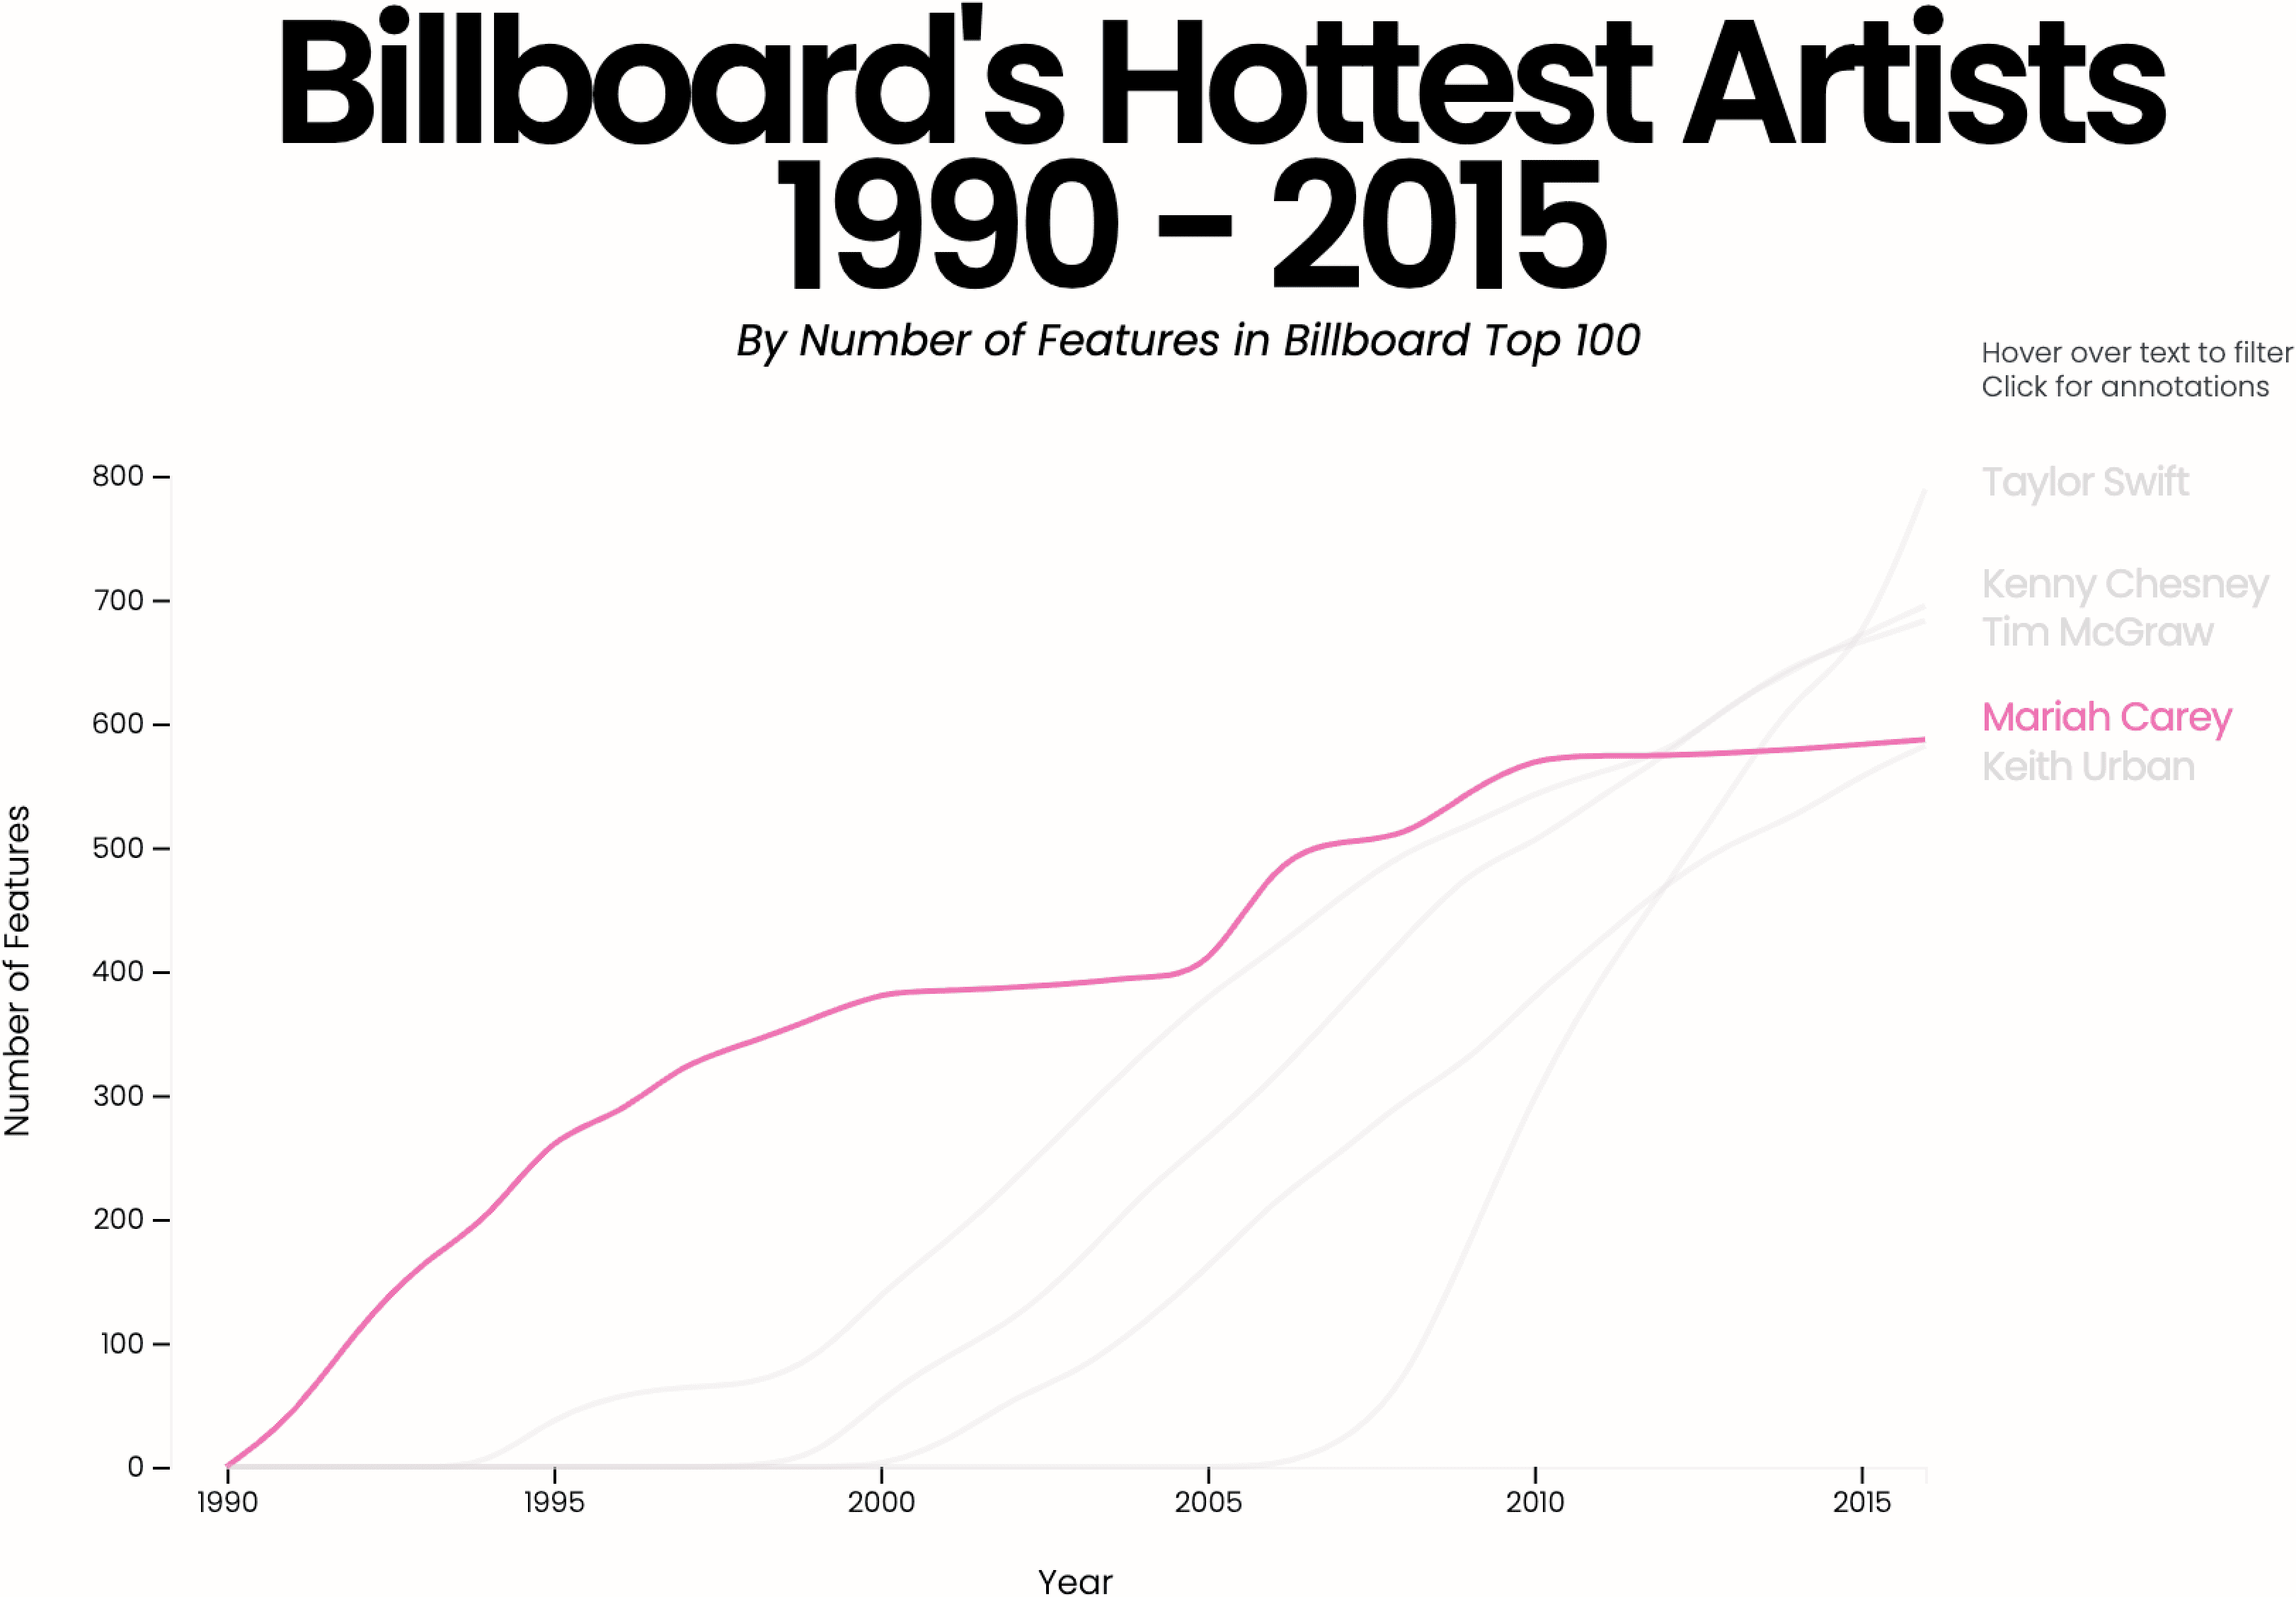
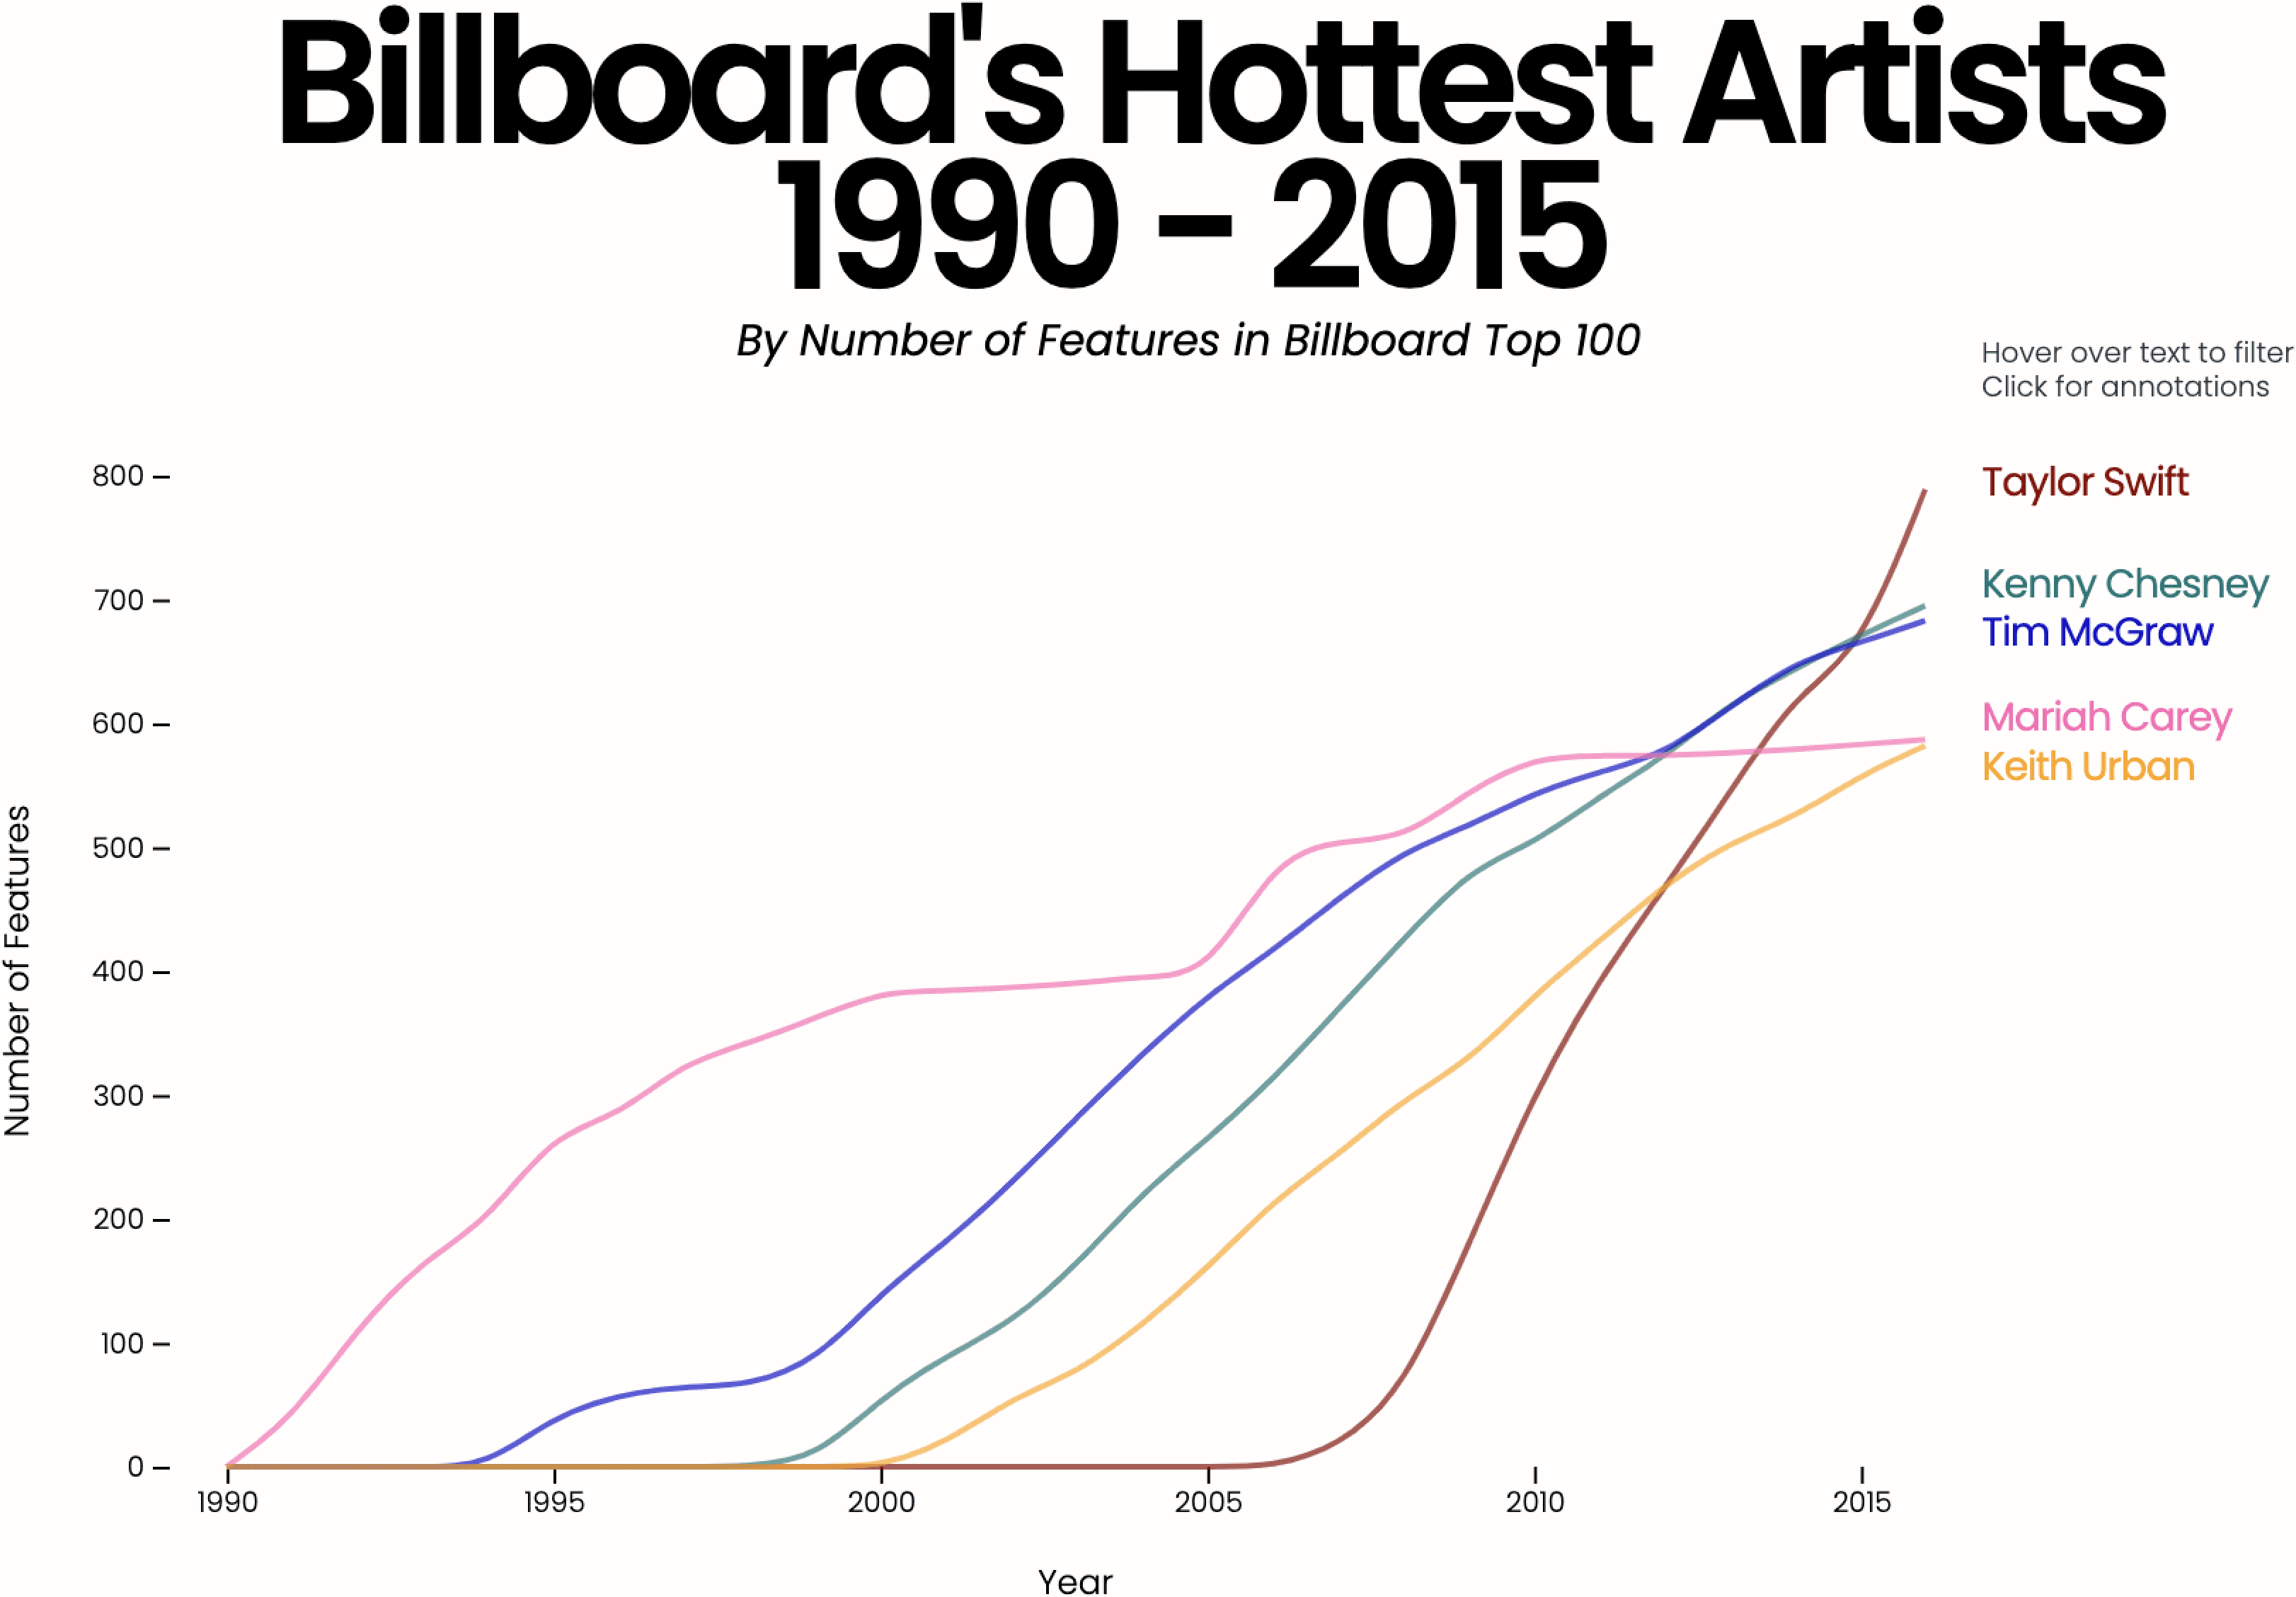
We visualised the 5 artists who had the most features over the 25 years and charted their journeys to the top.
We visualised the 5 artists who had the most features over the 25 years and charted their journeys to the top.



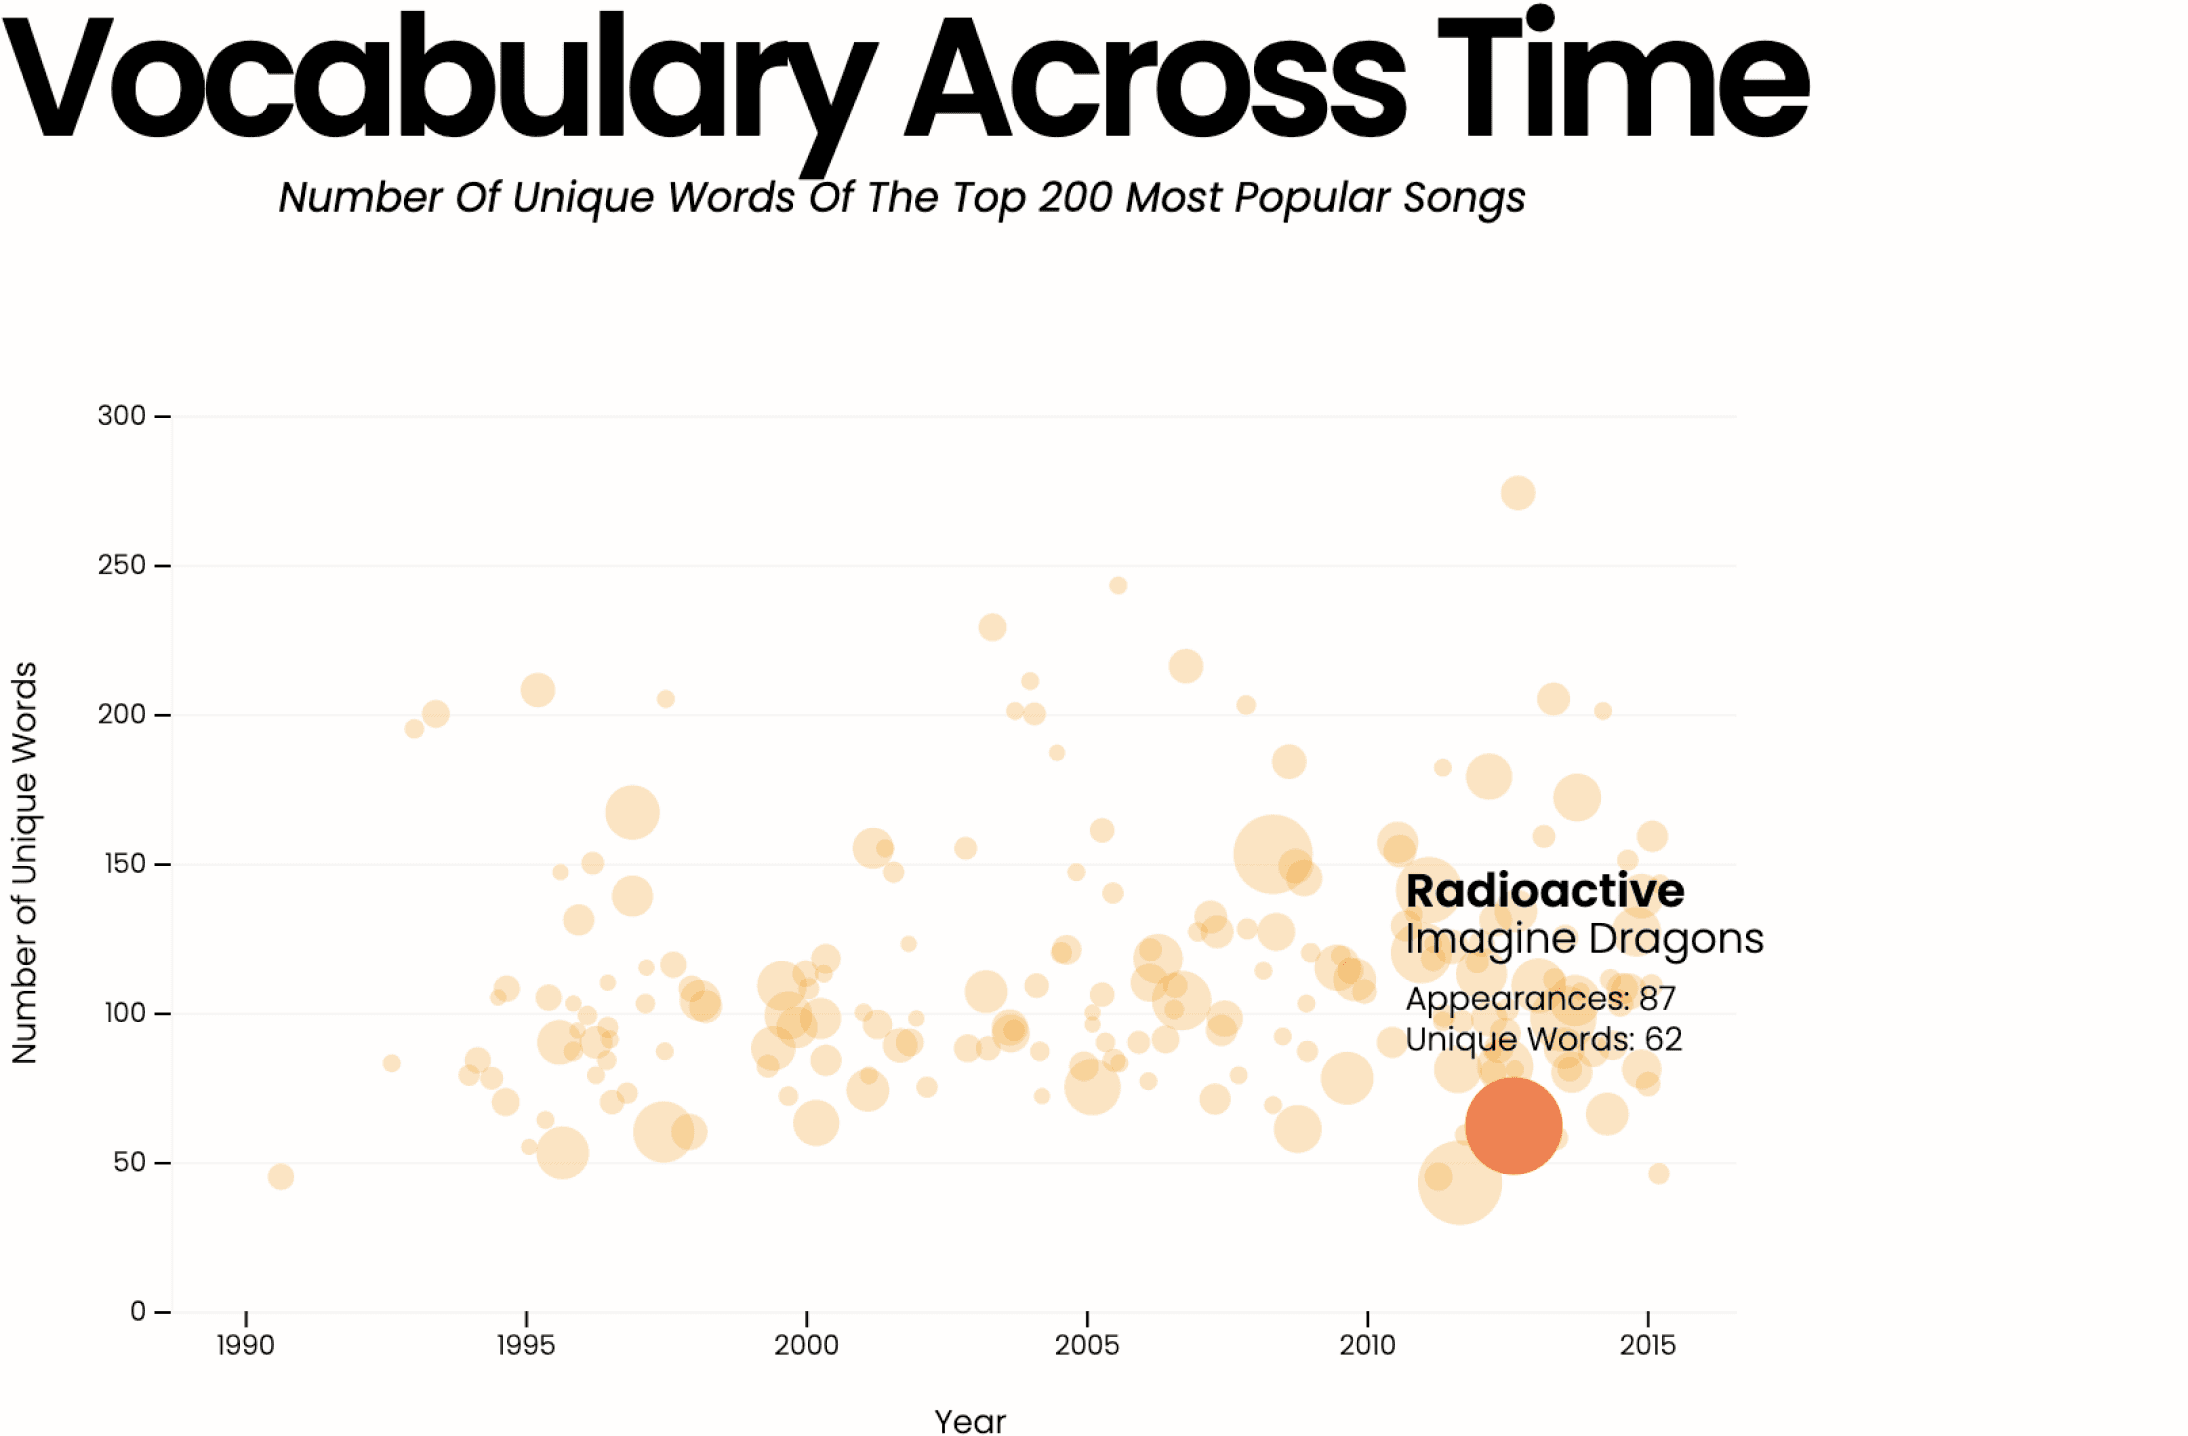
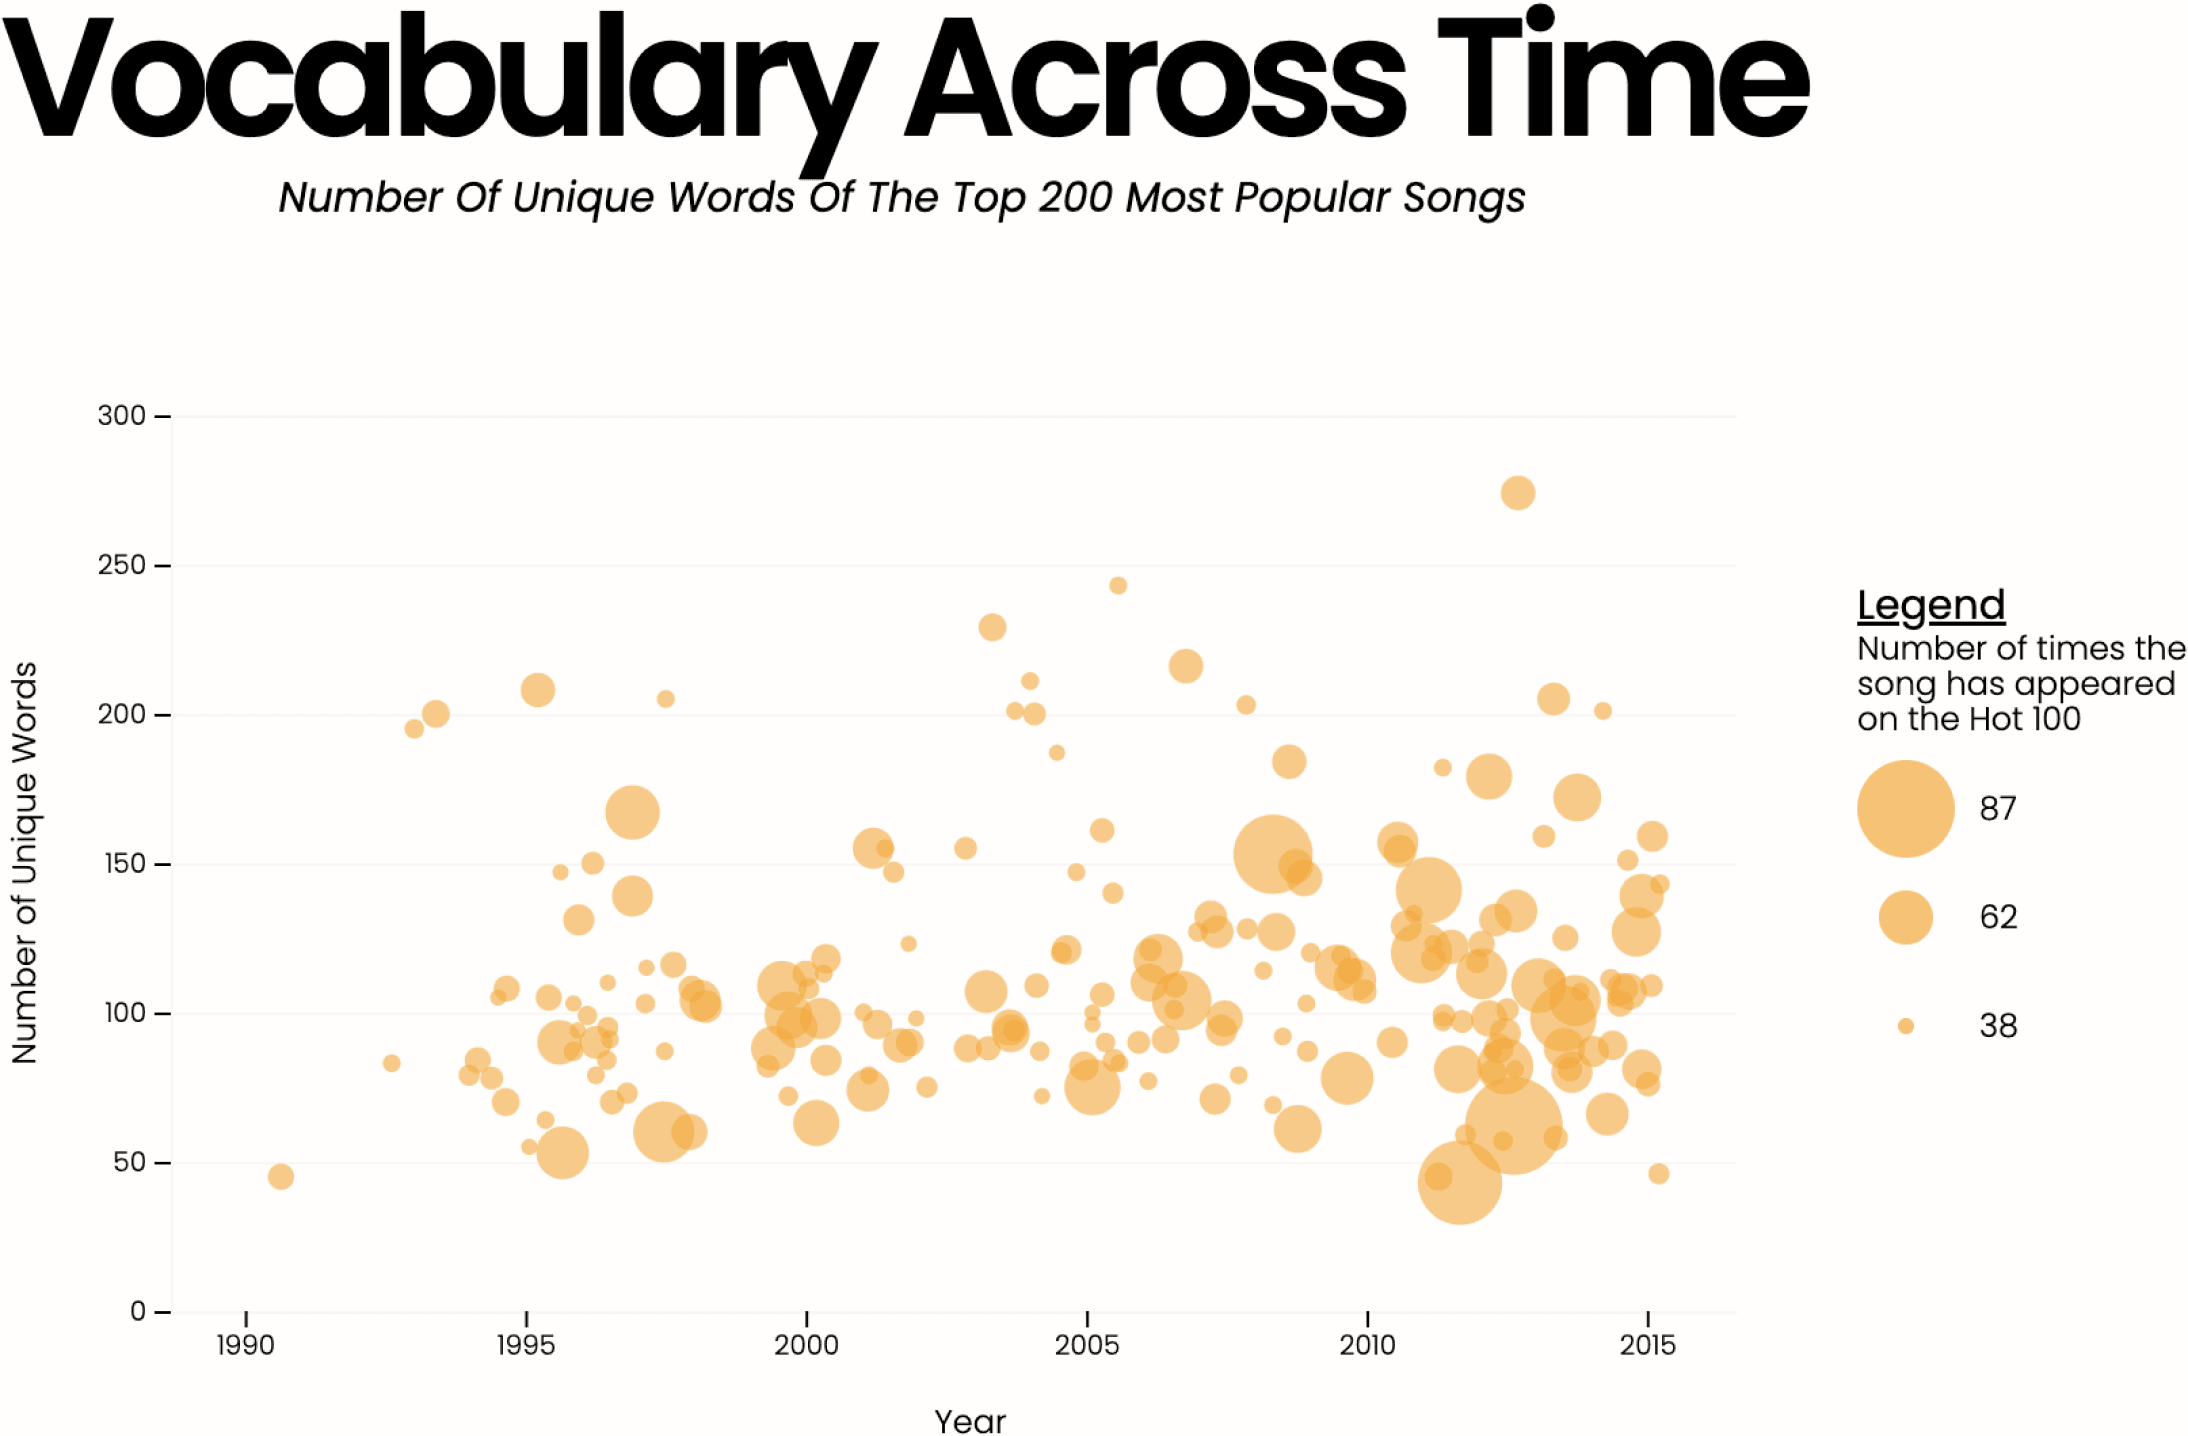
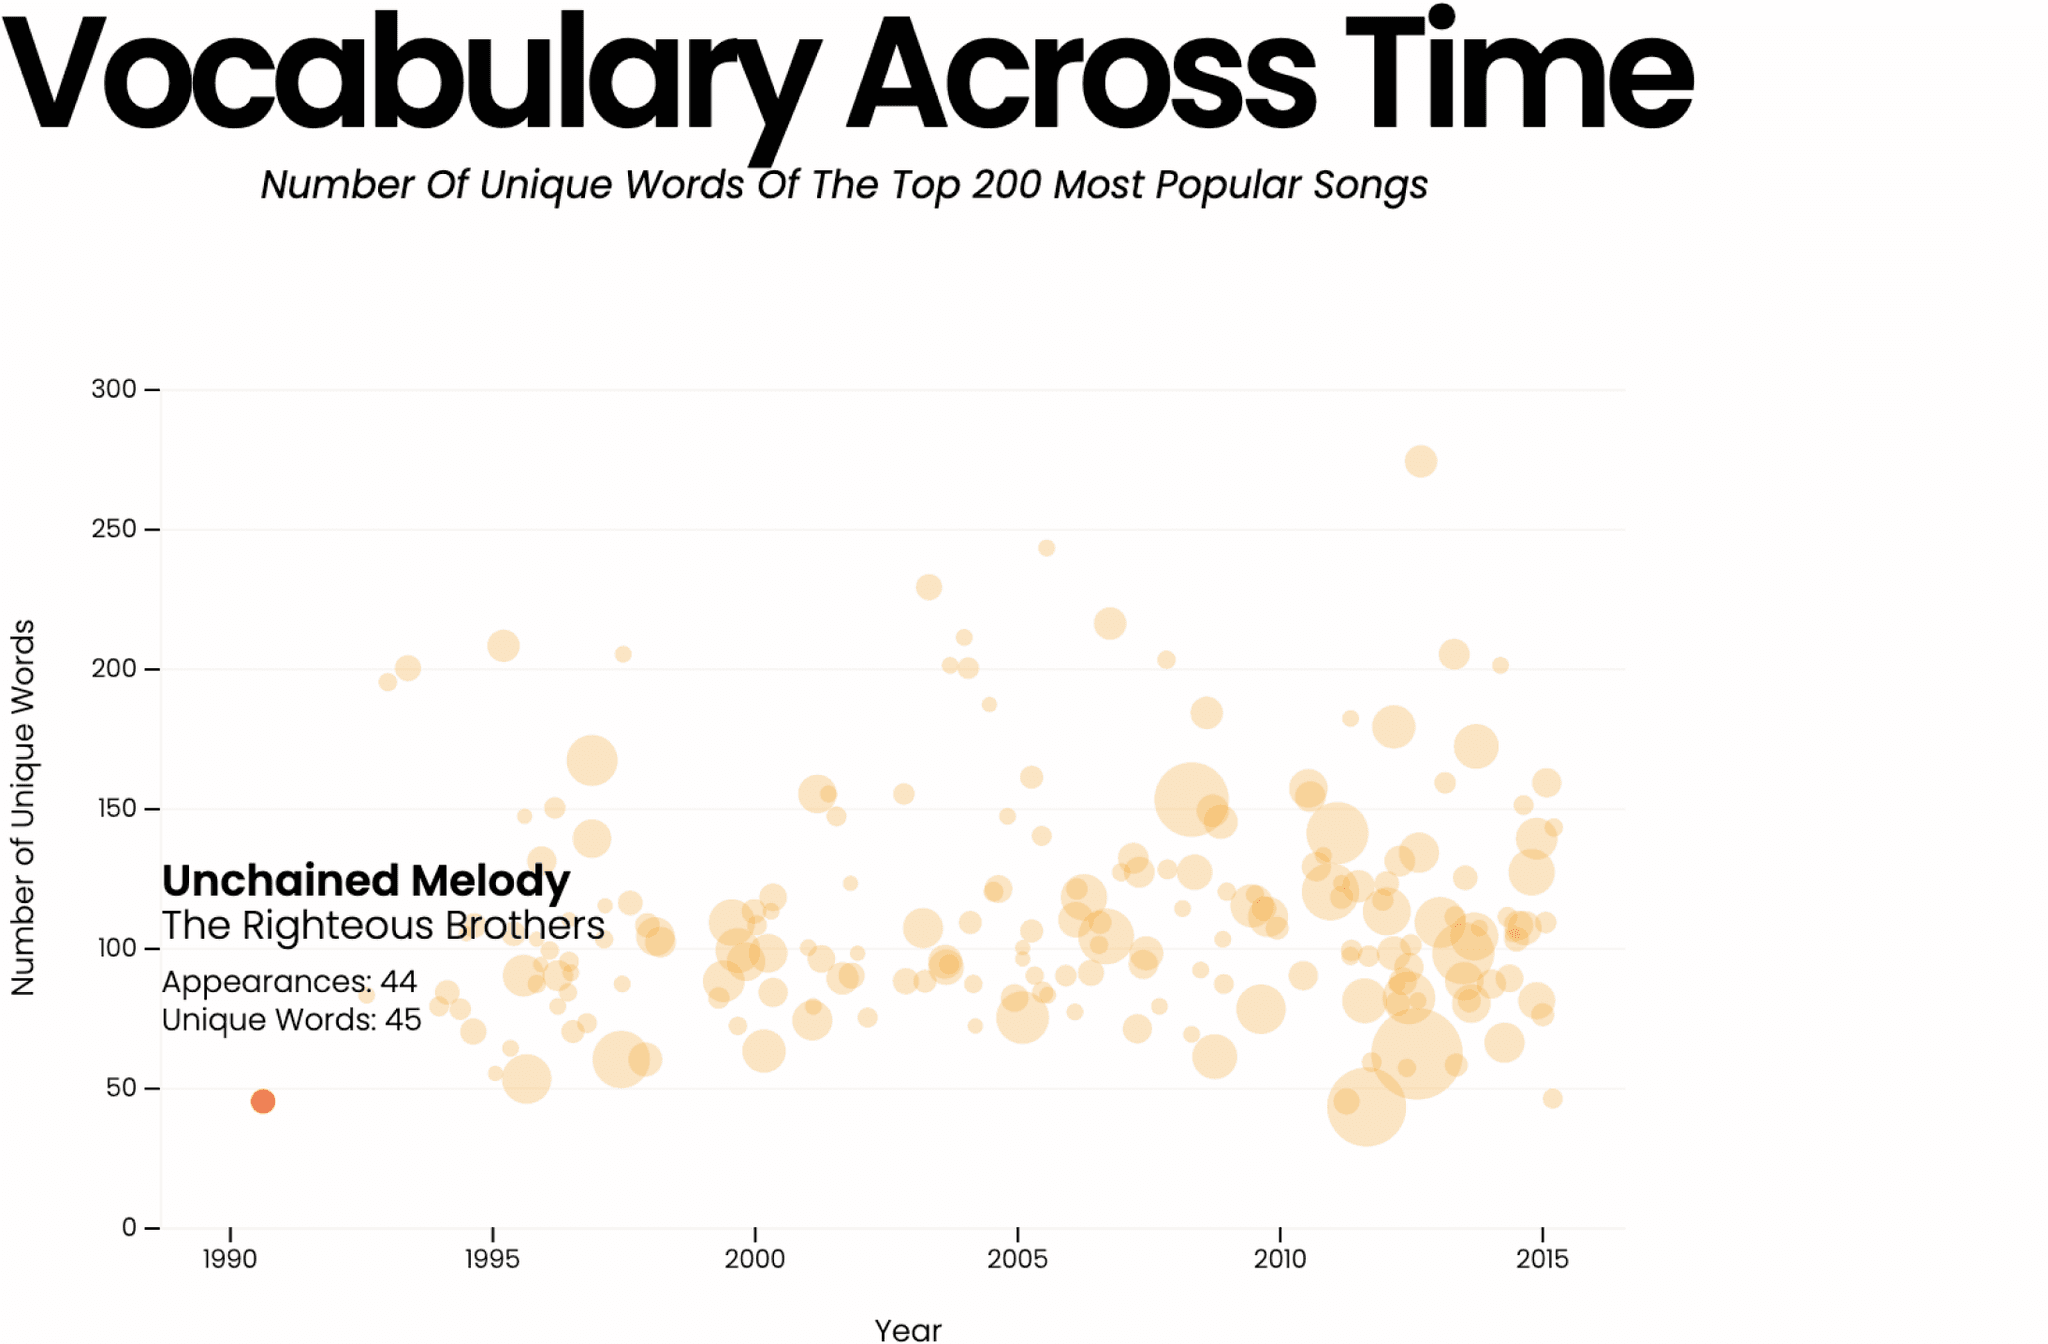
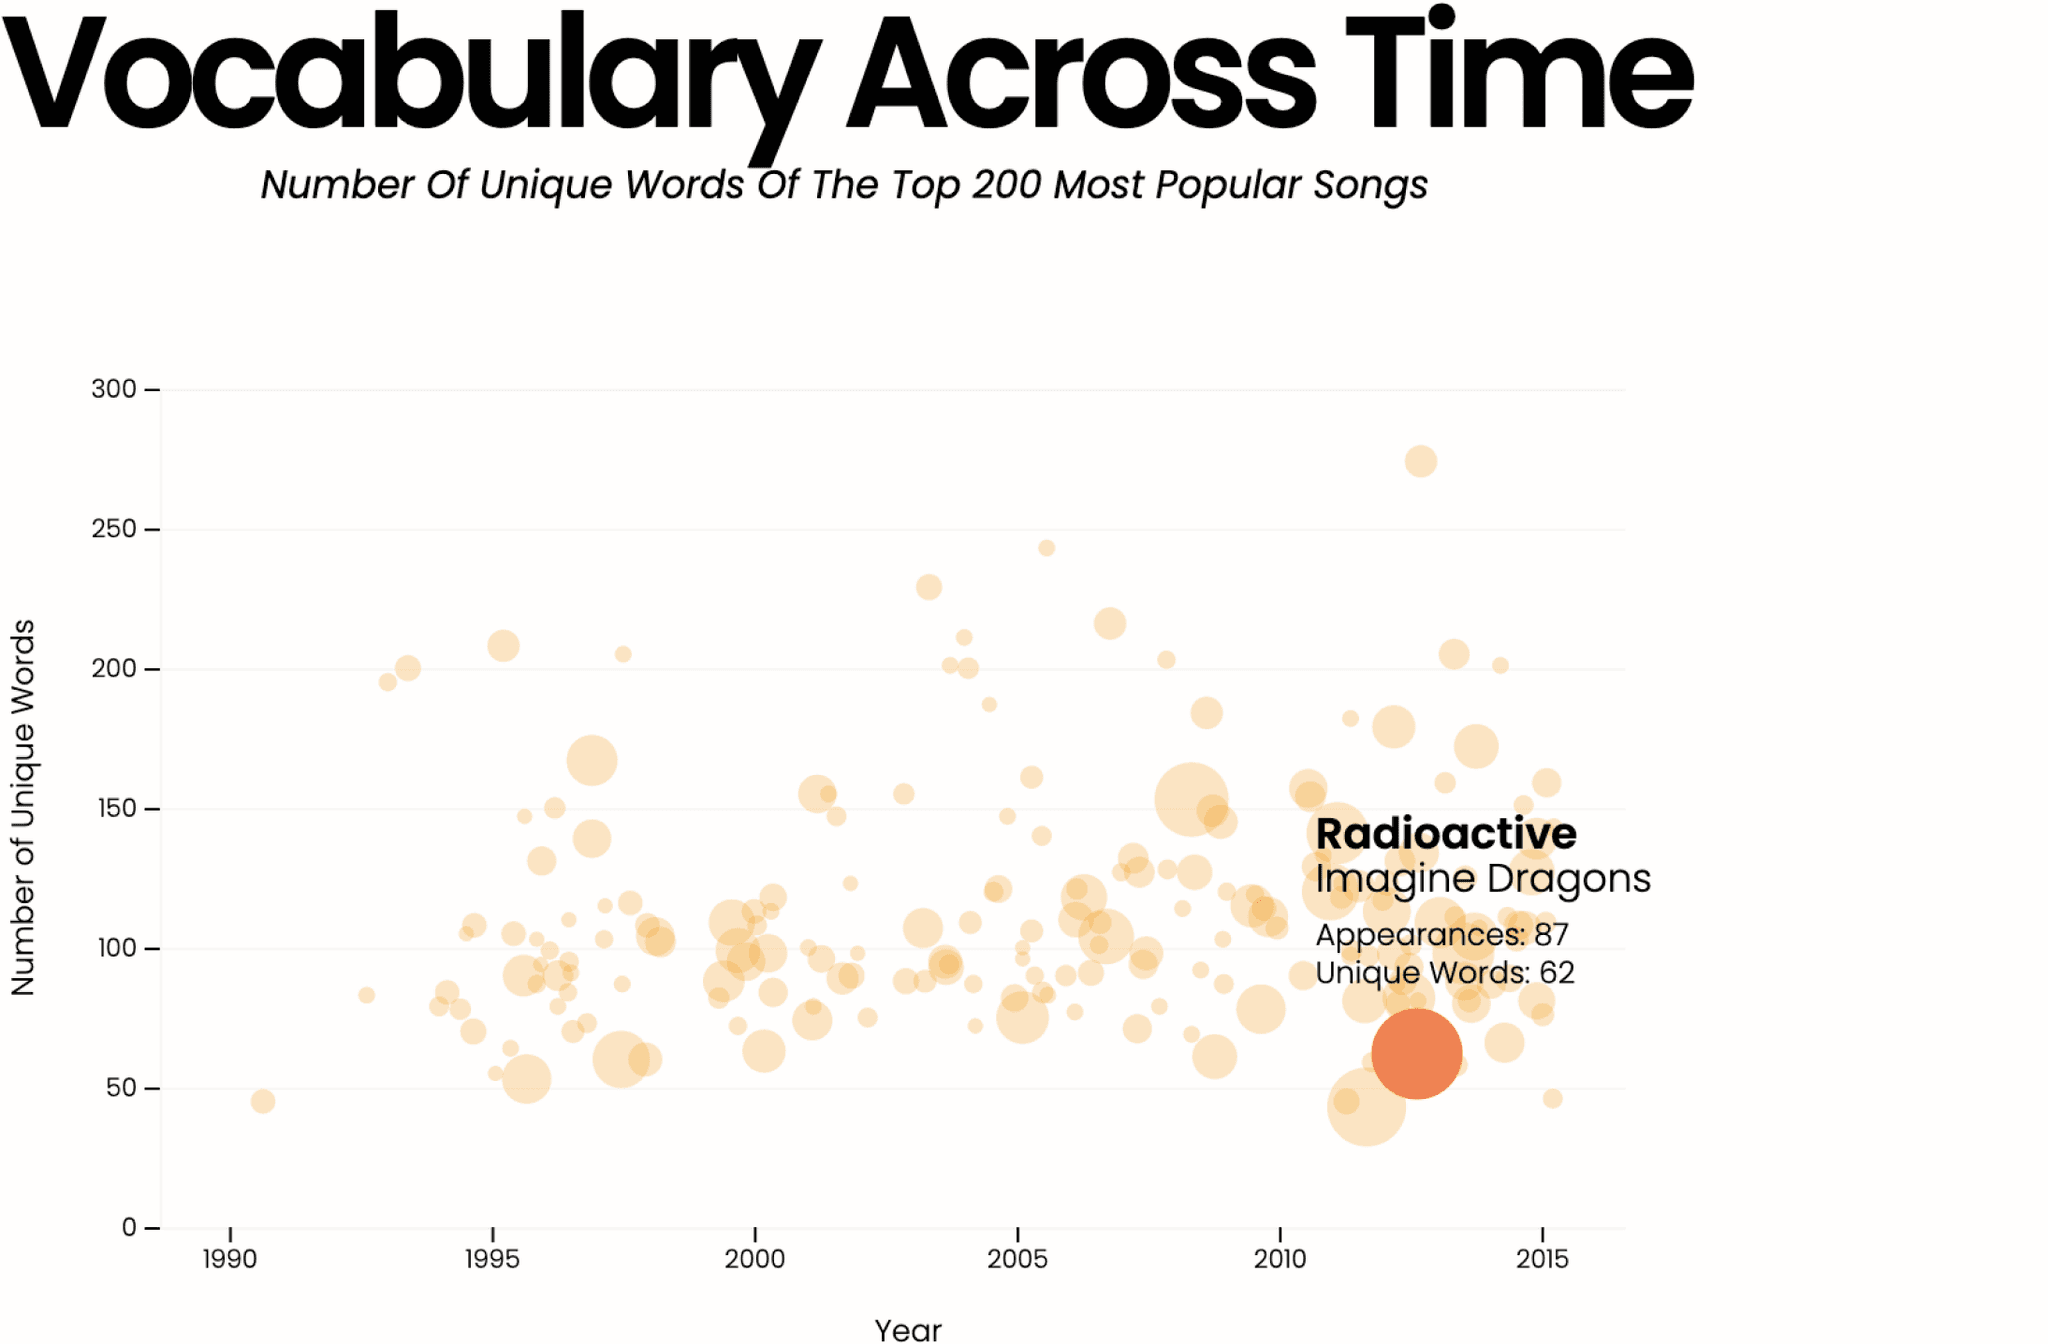
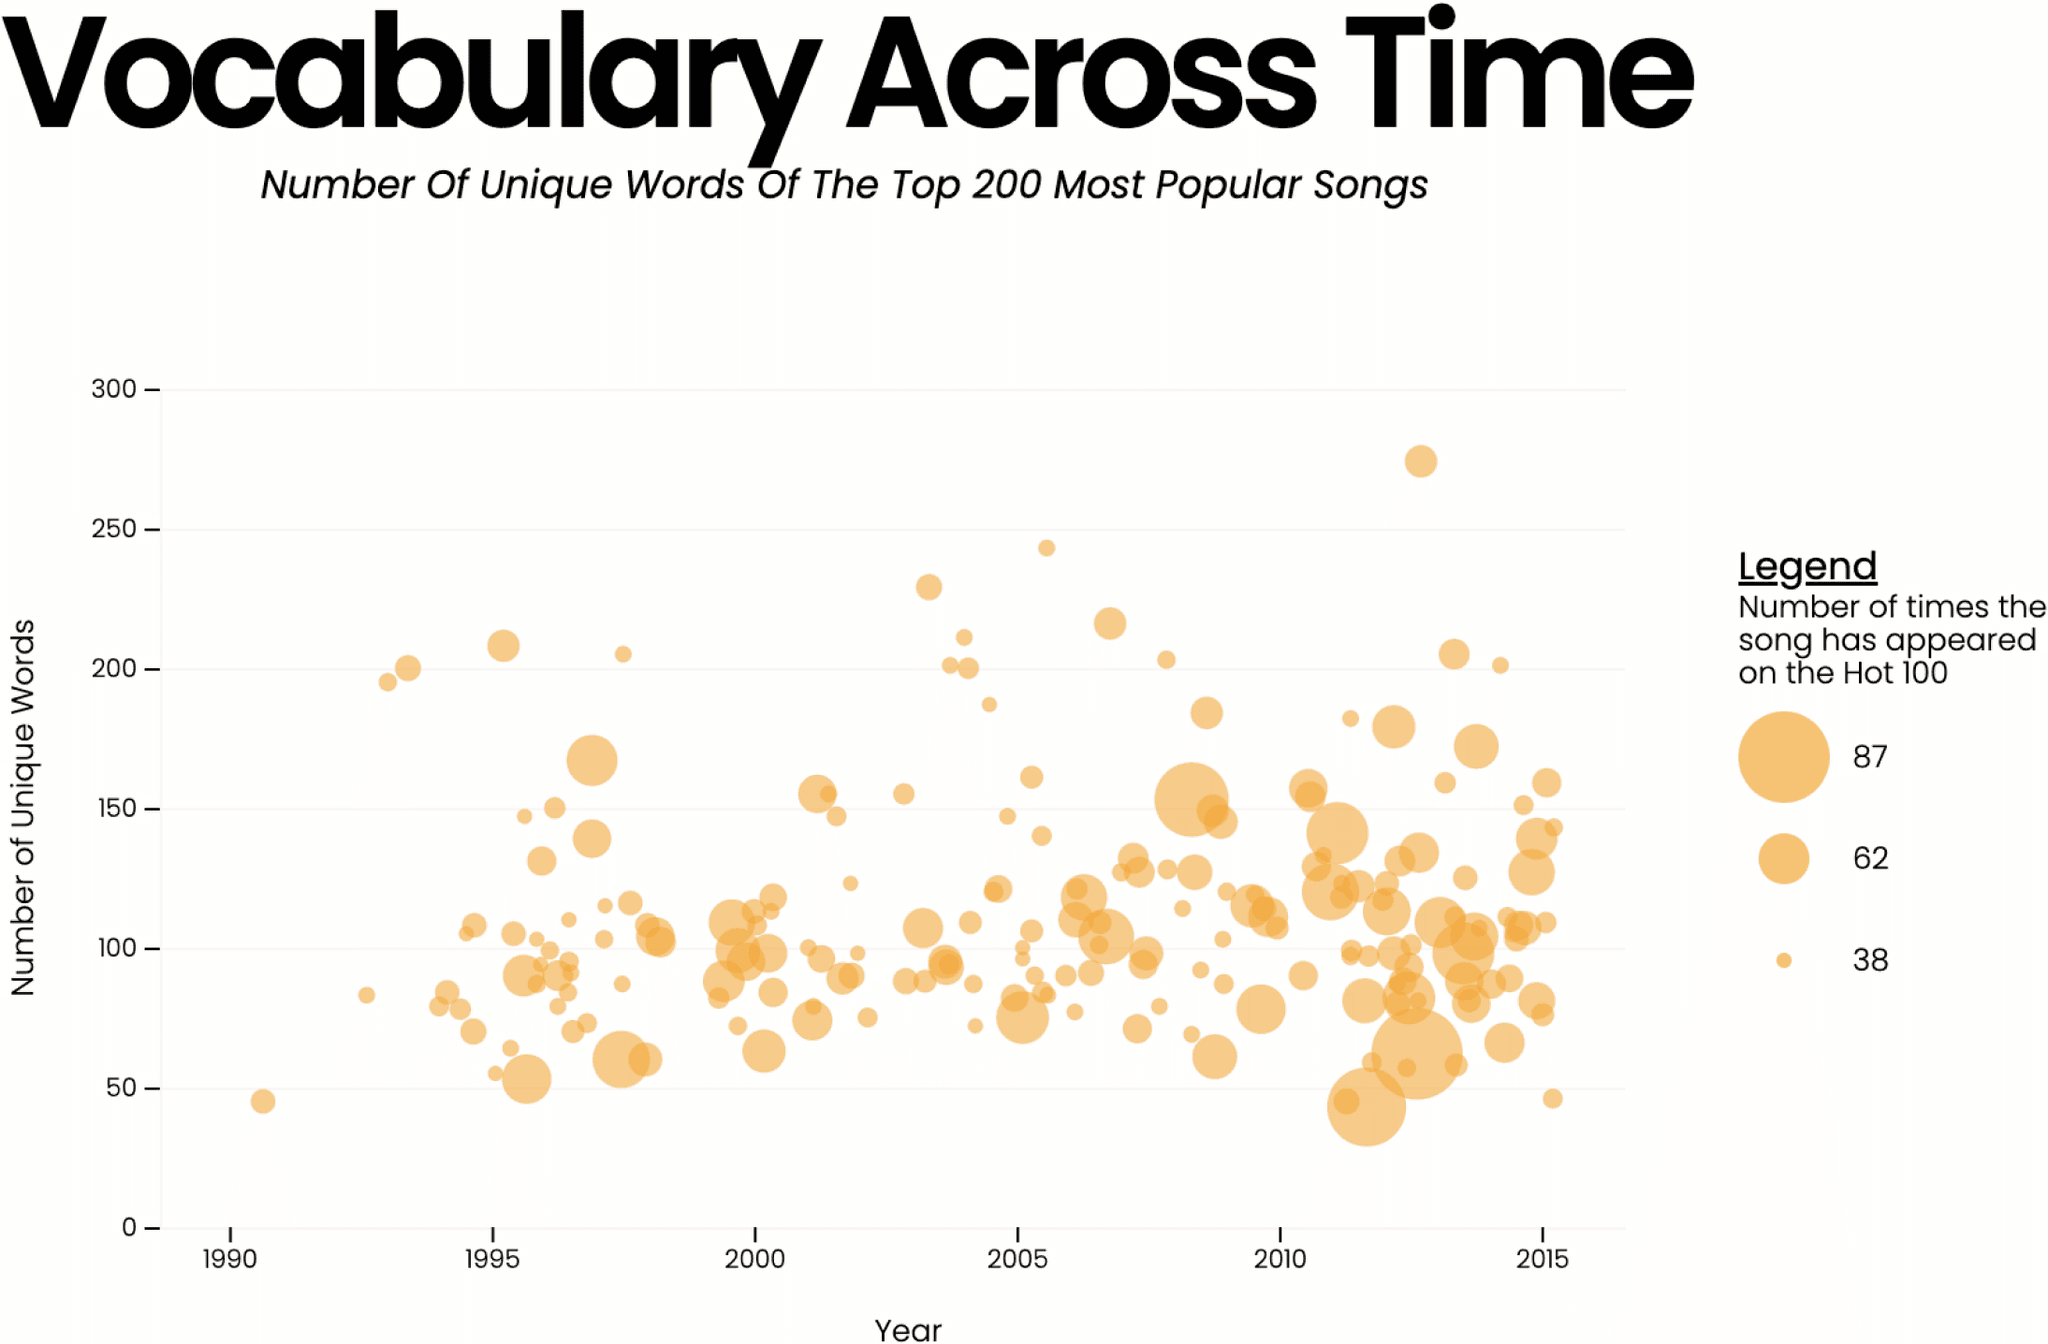
Had lyrics gotten simpler over time?
Had lyrics gotten simpler over time?
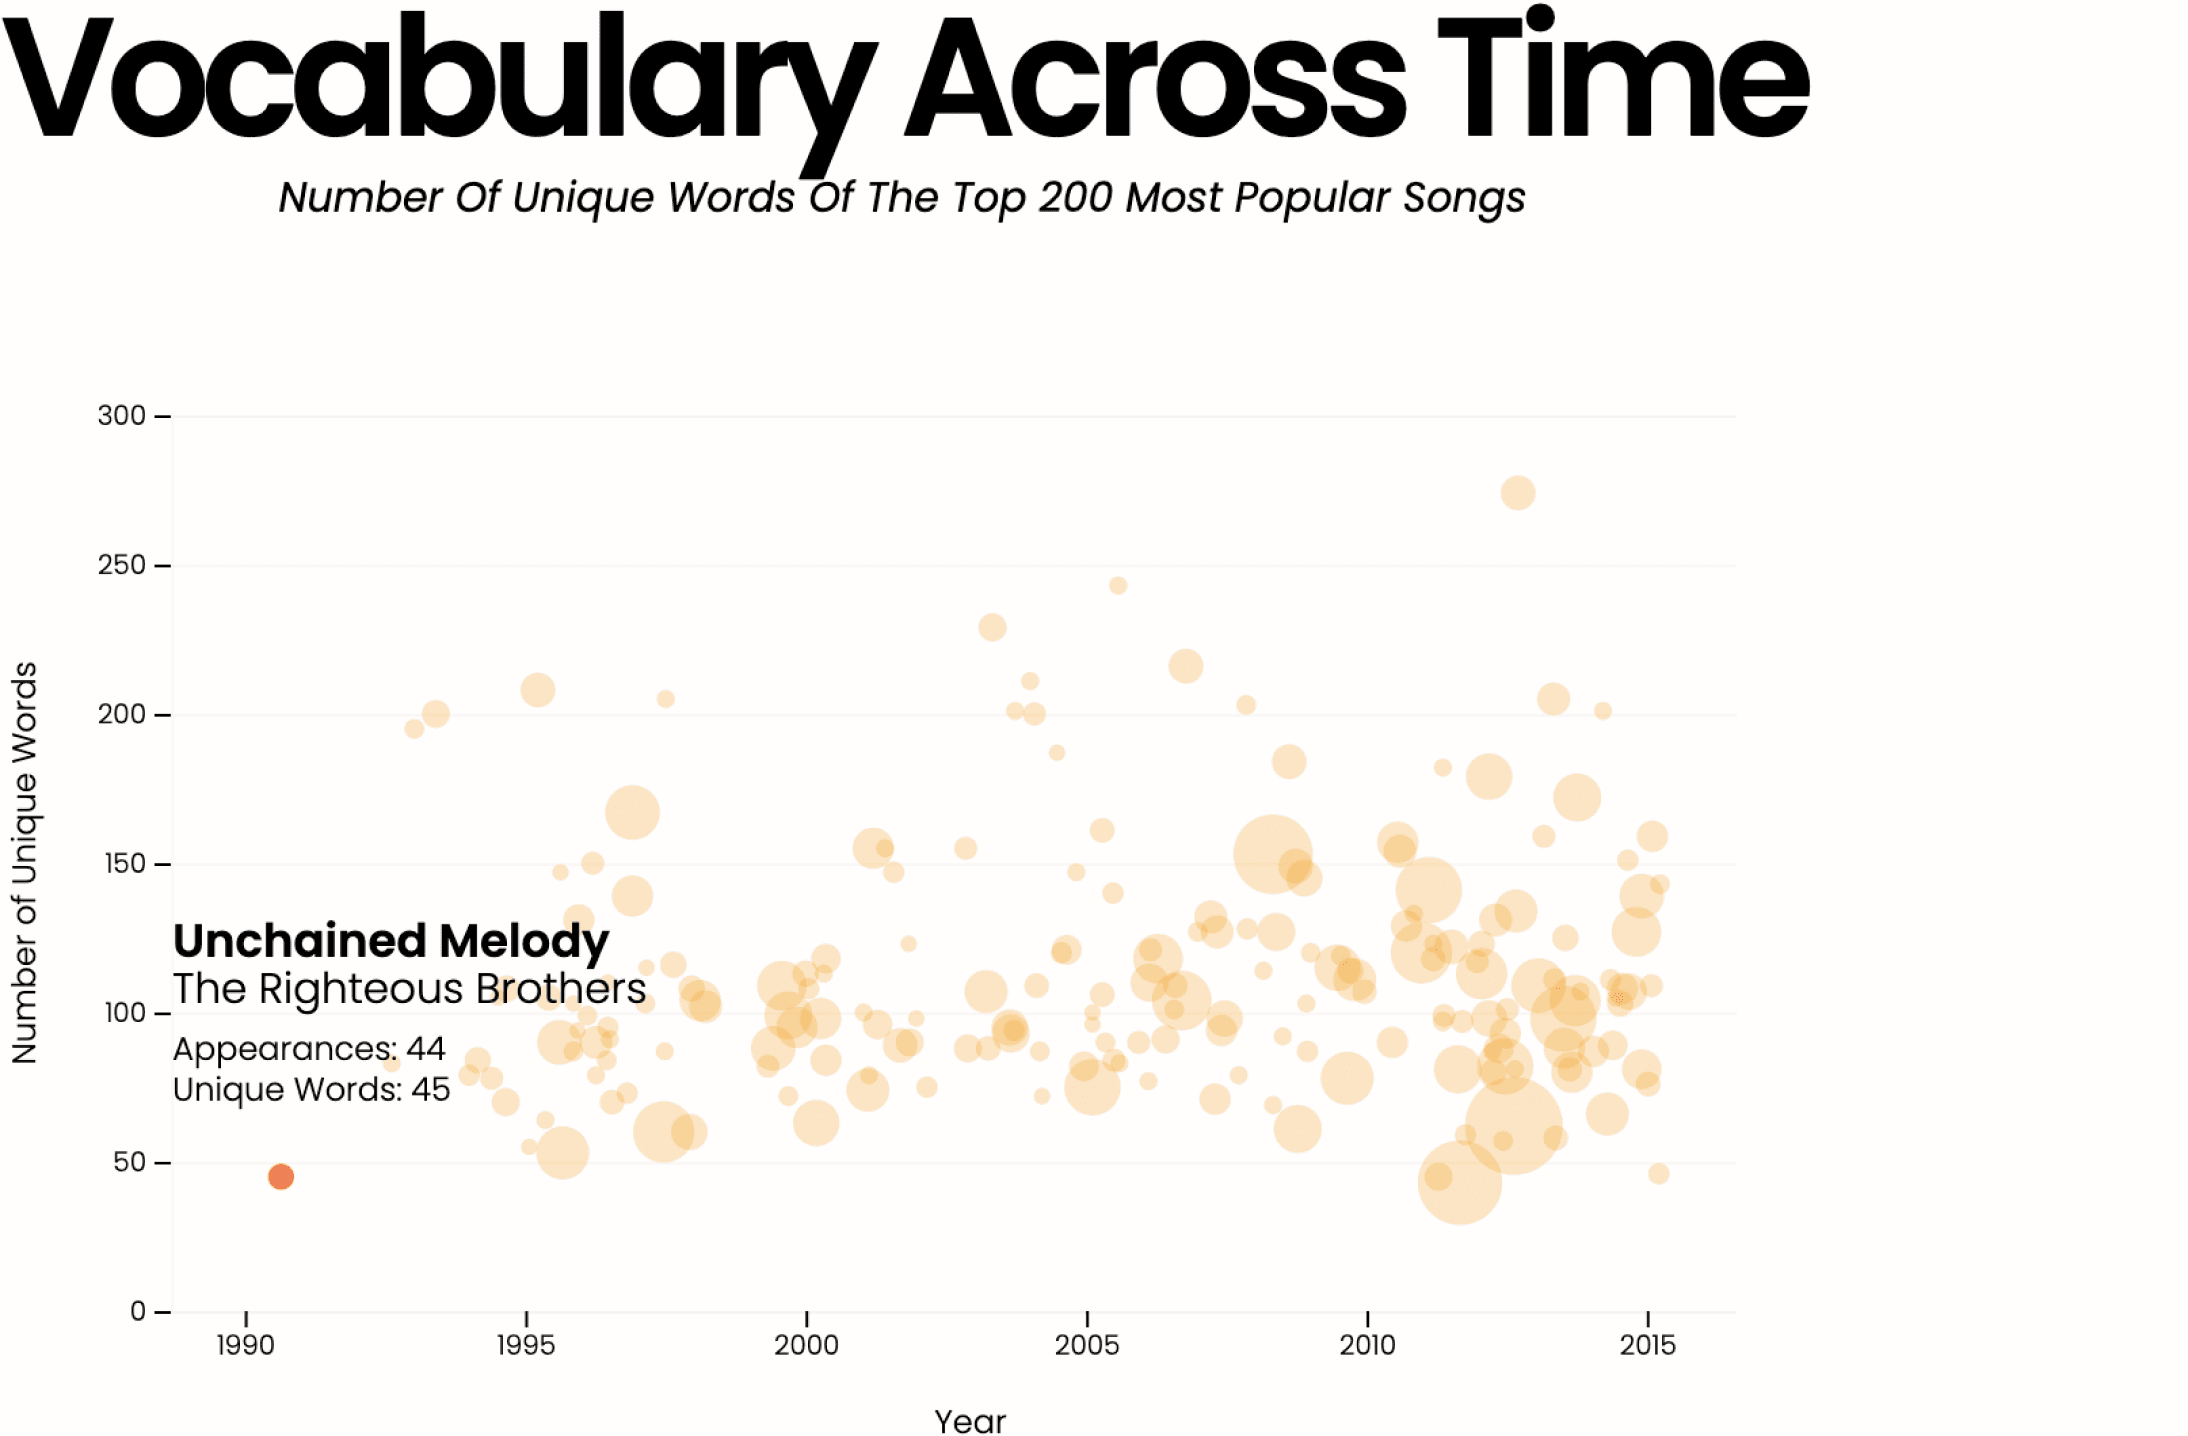
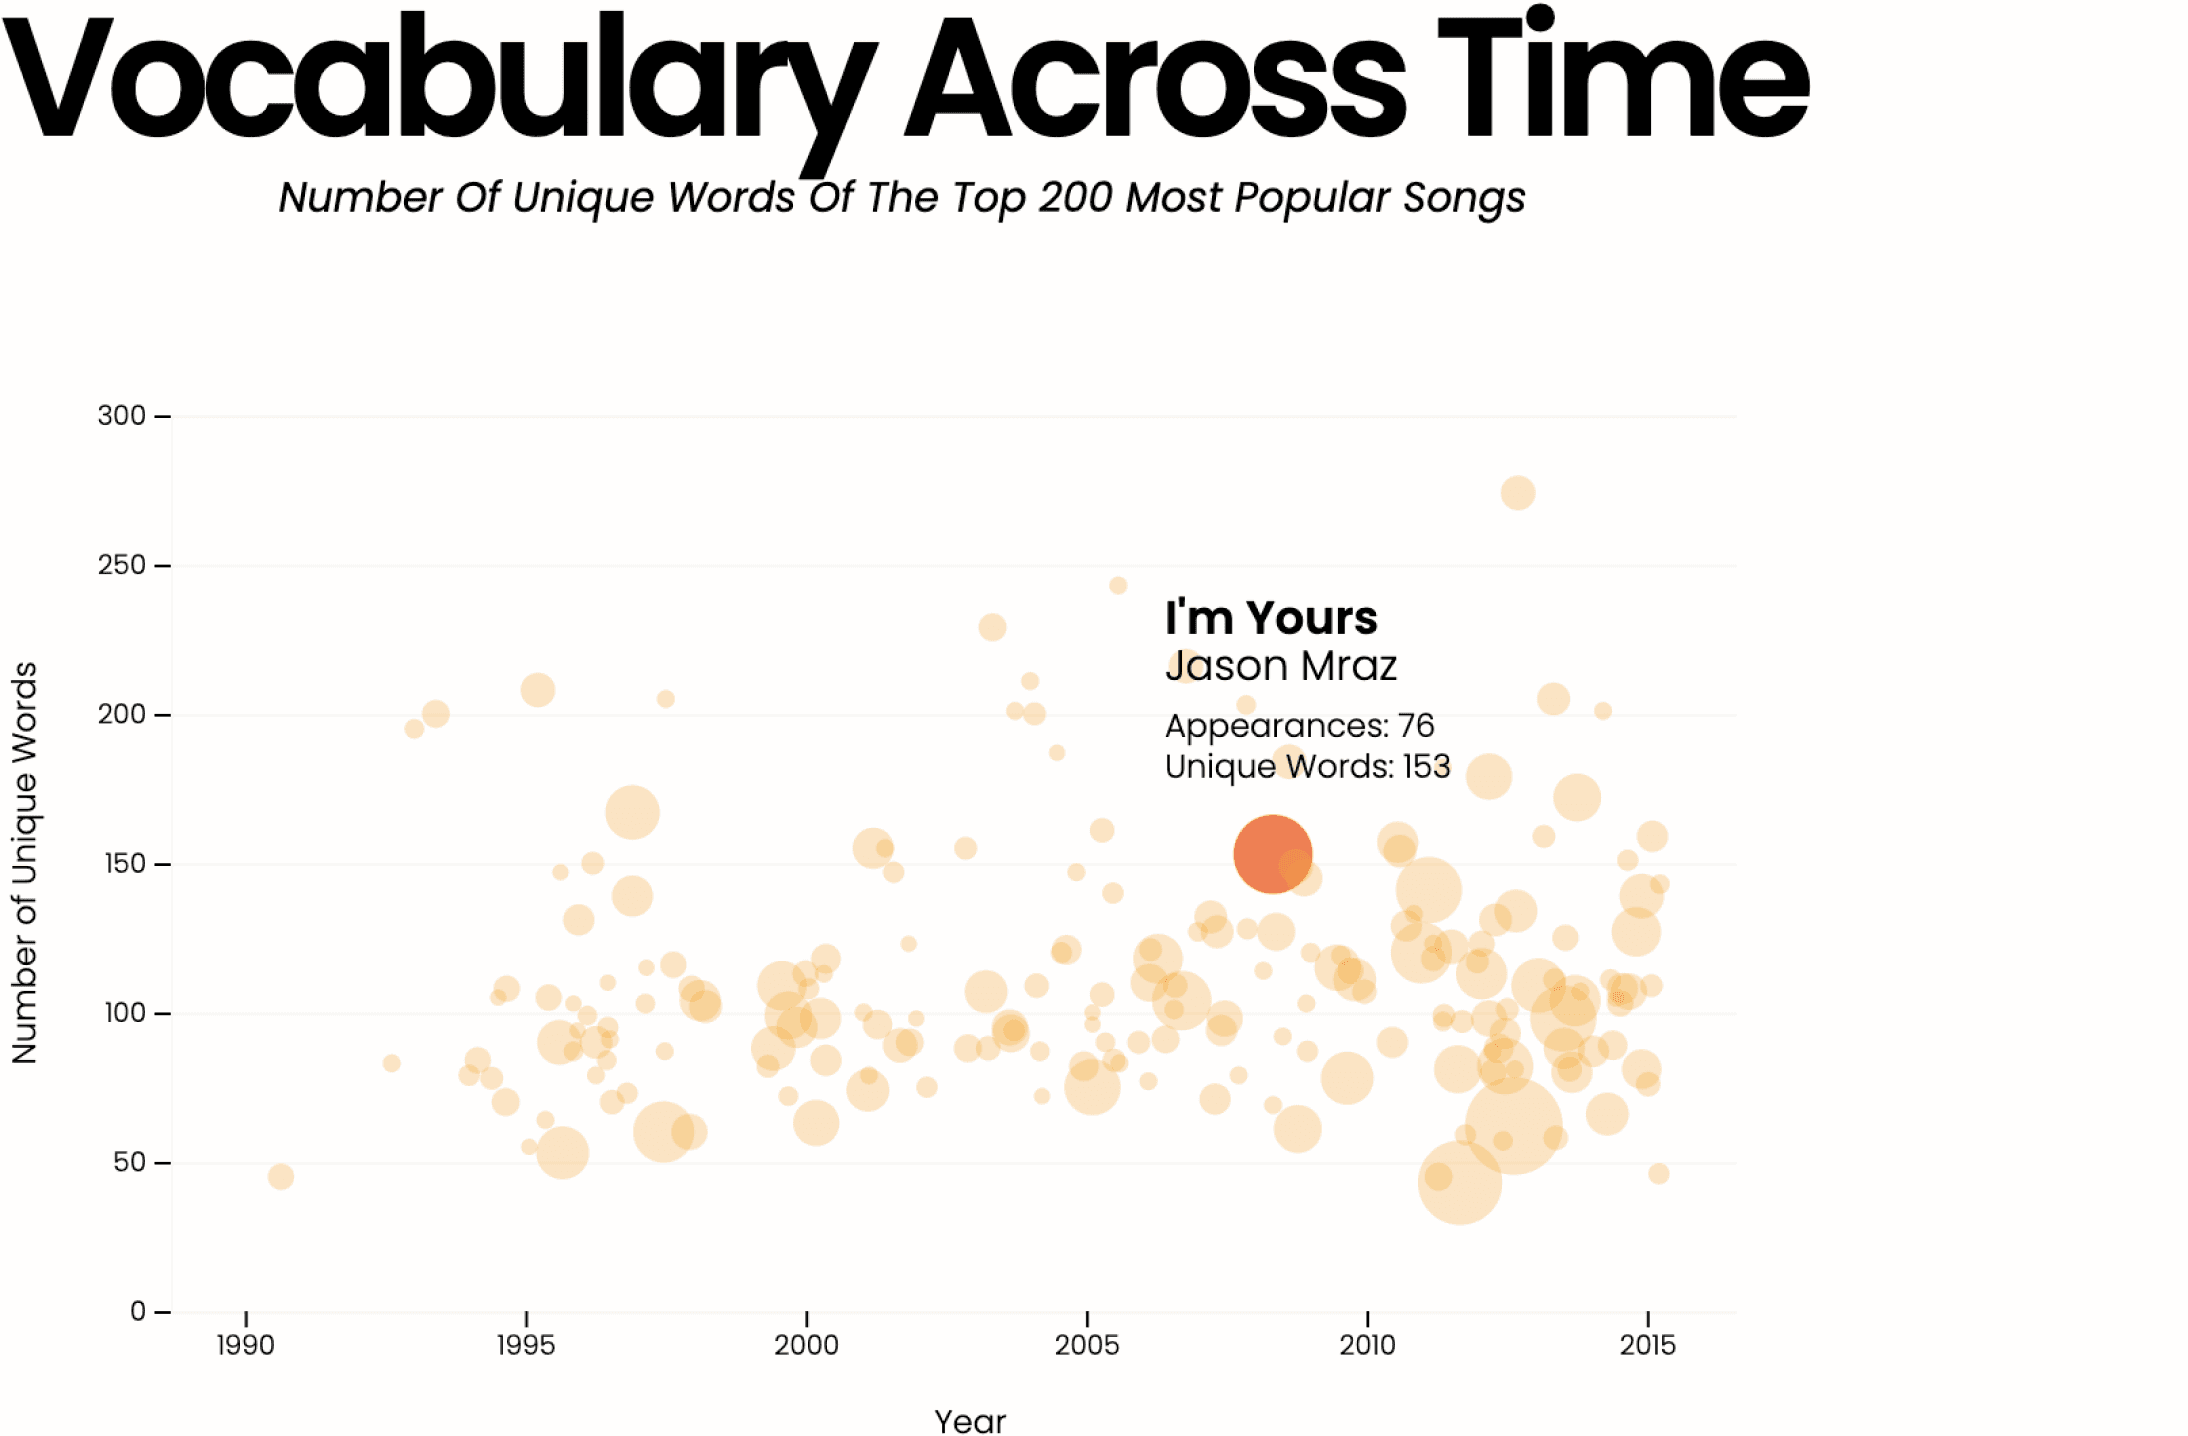
At the time, it seemed as if the lyrics of the most popular songs were less diverse and more repetitive, so we were interested in taking a closer look. But not too close. And only with one eye.
At the time, it seemed as if the lyrics of the most popular songs were less diverse and more repetitive, so we were interested in taking a closer look. But not too close. And only with one eye.



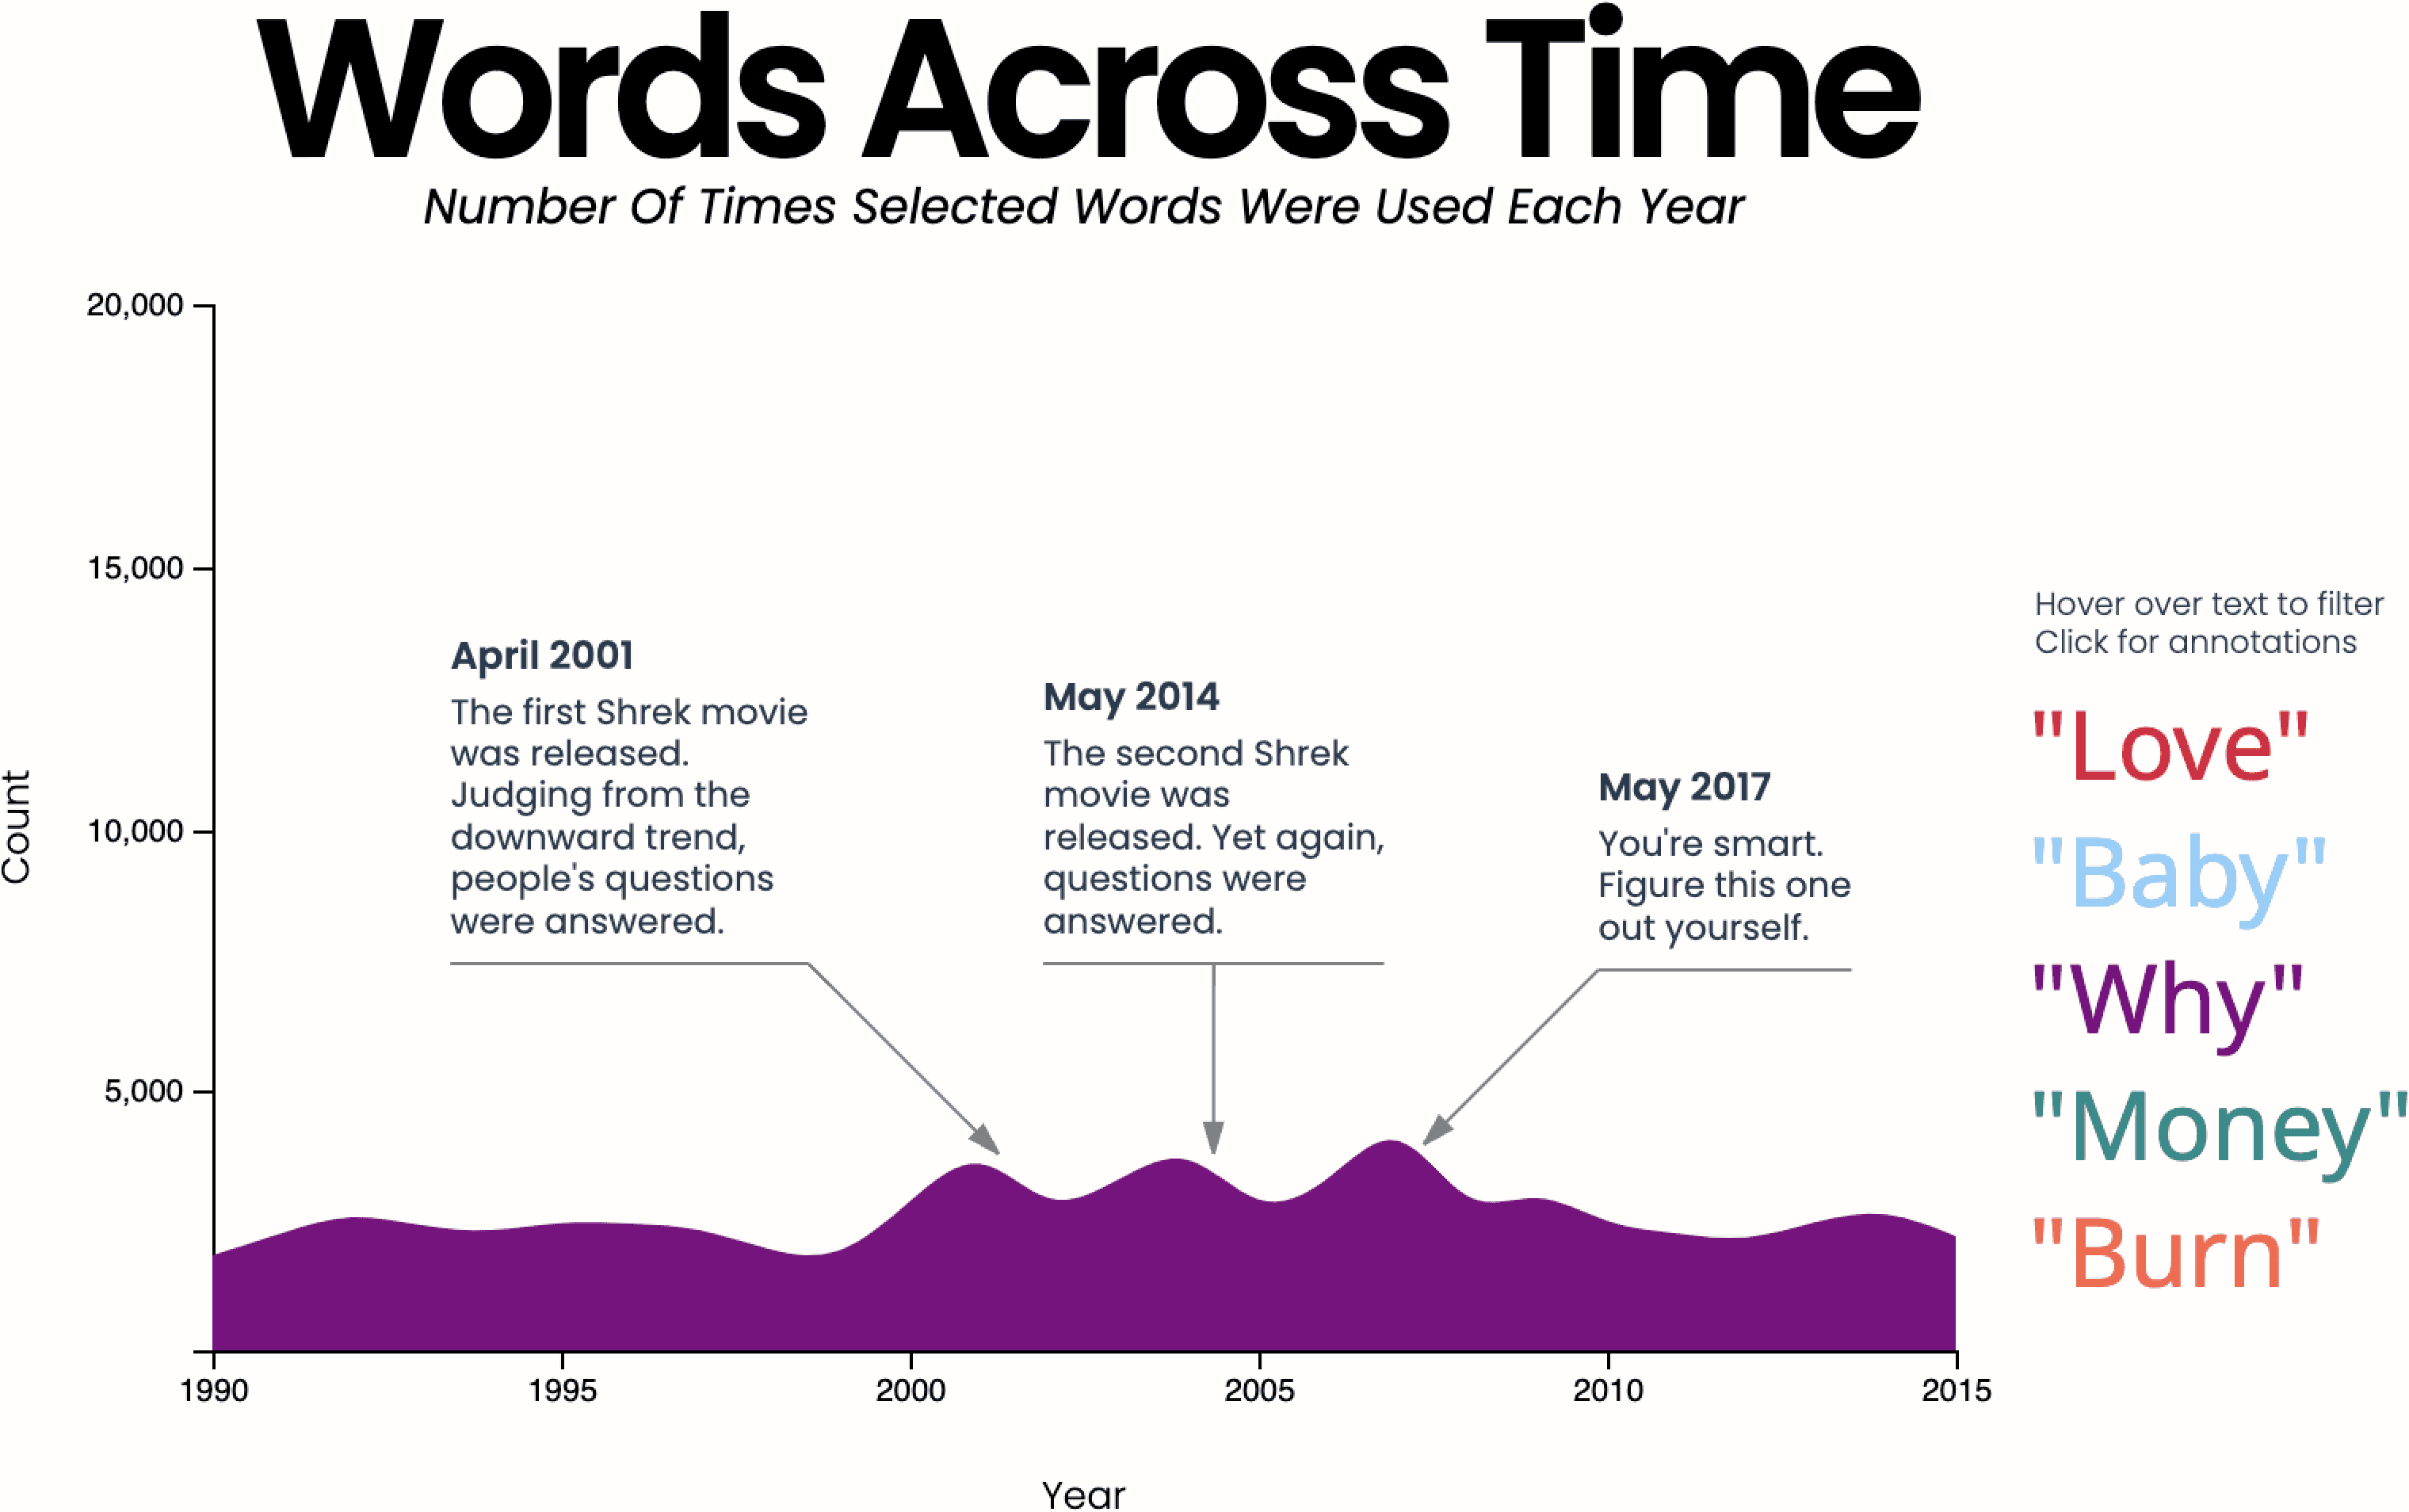
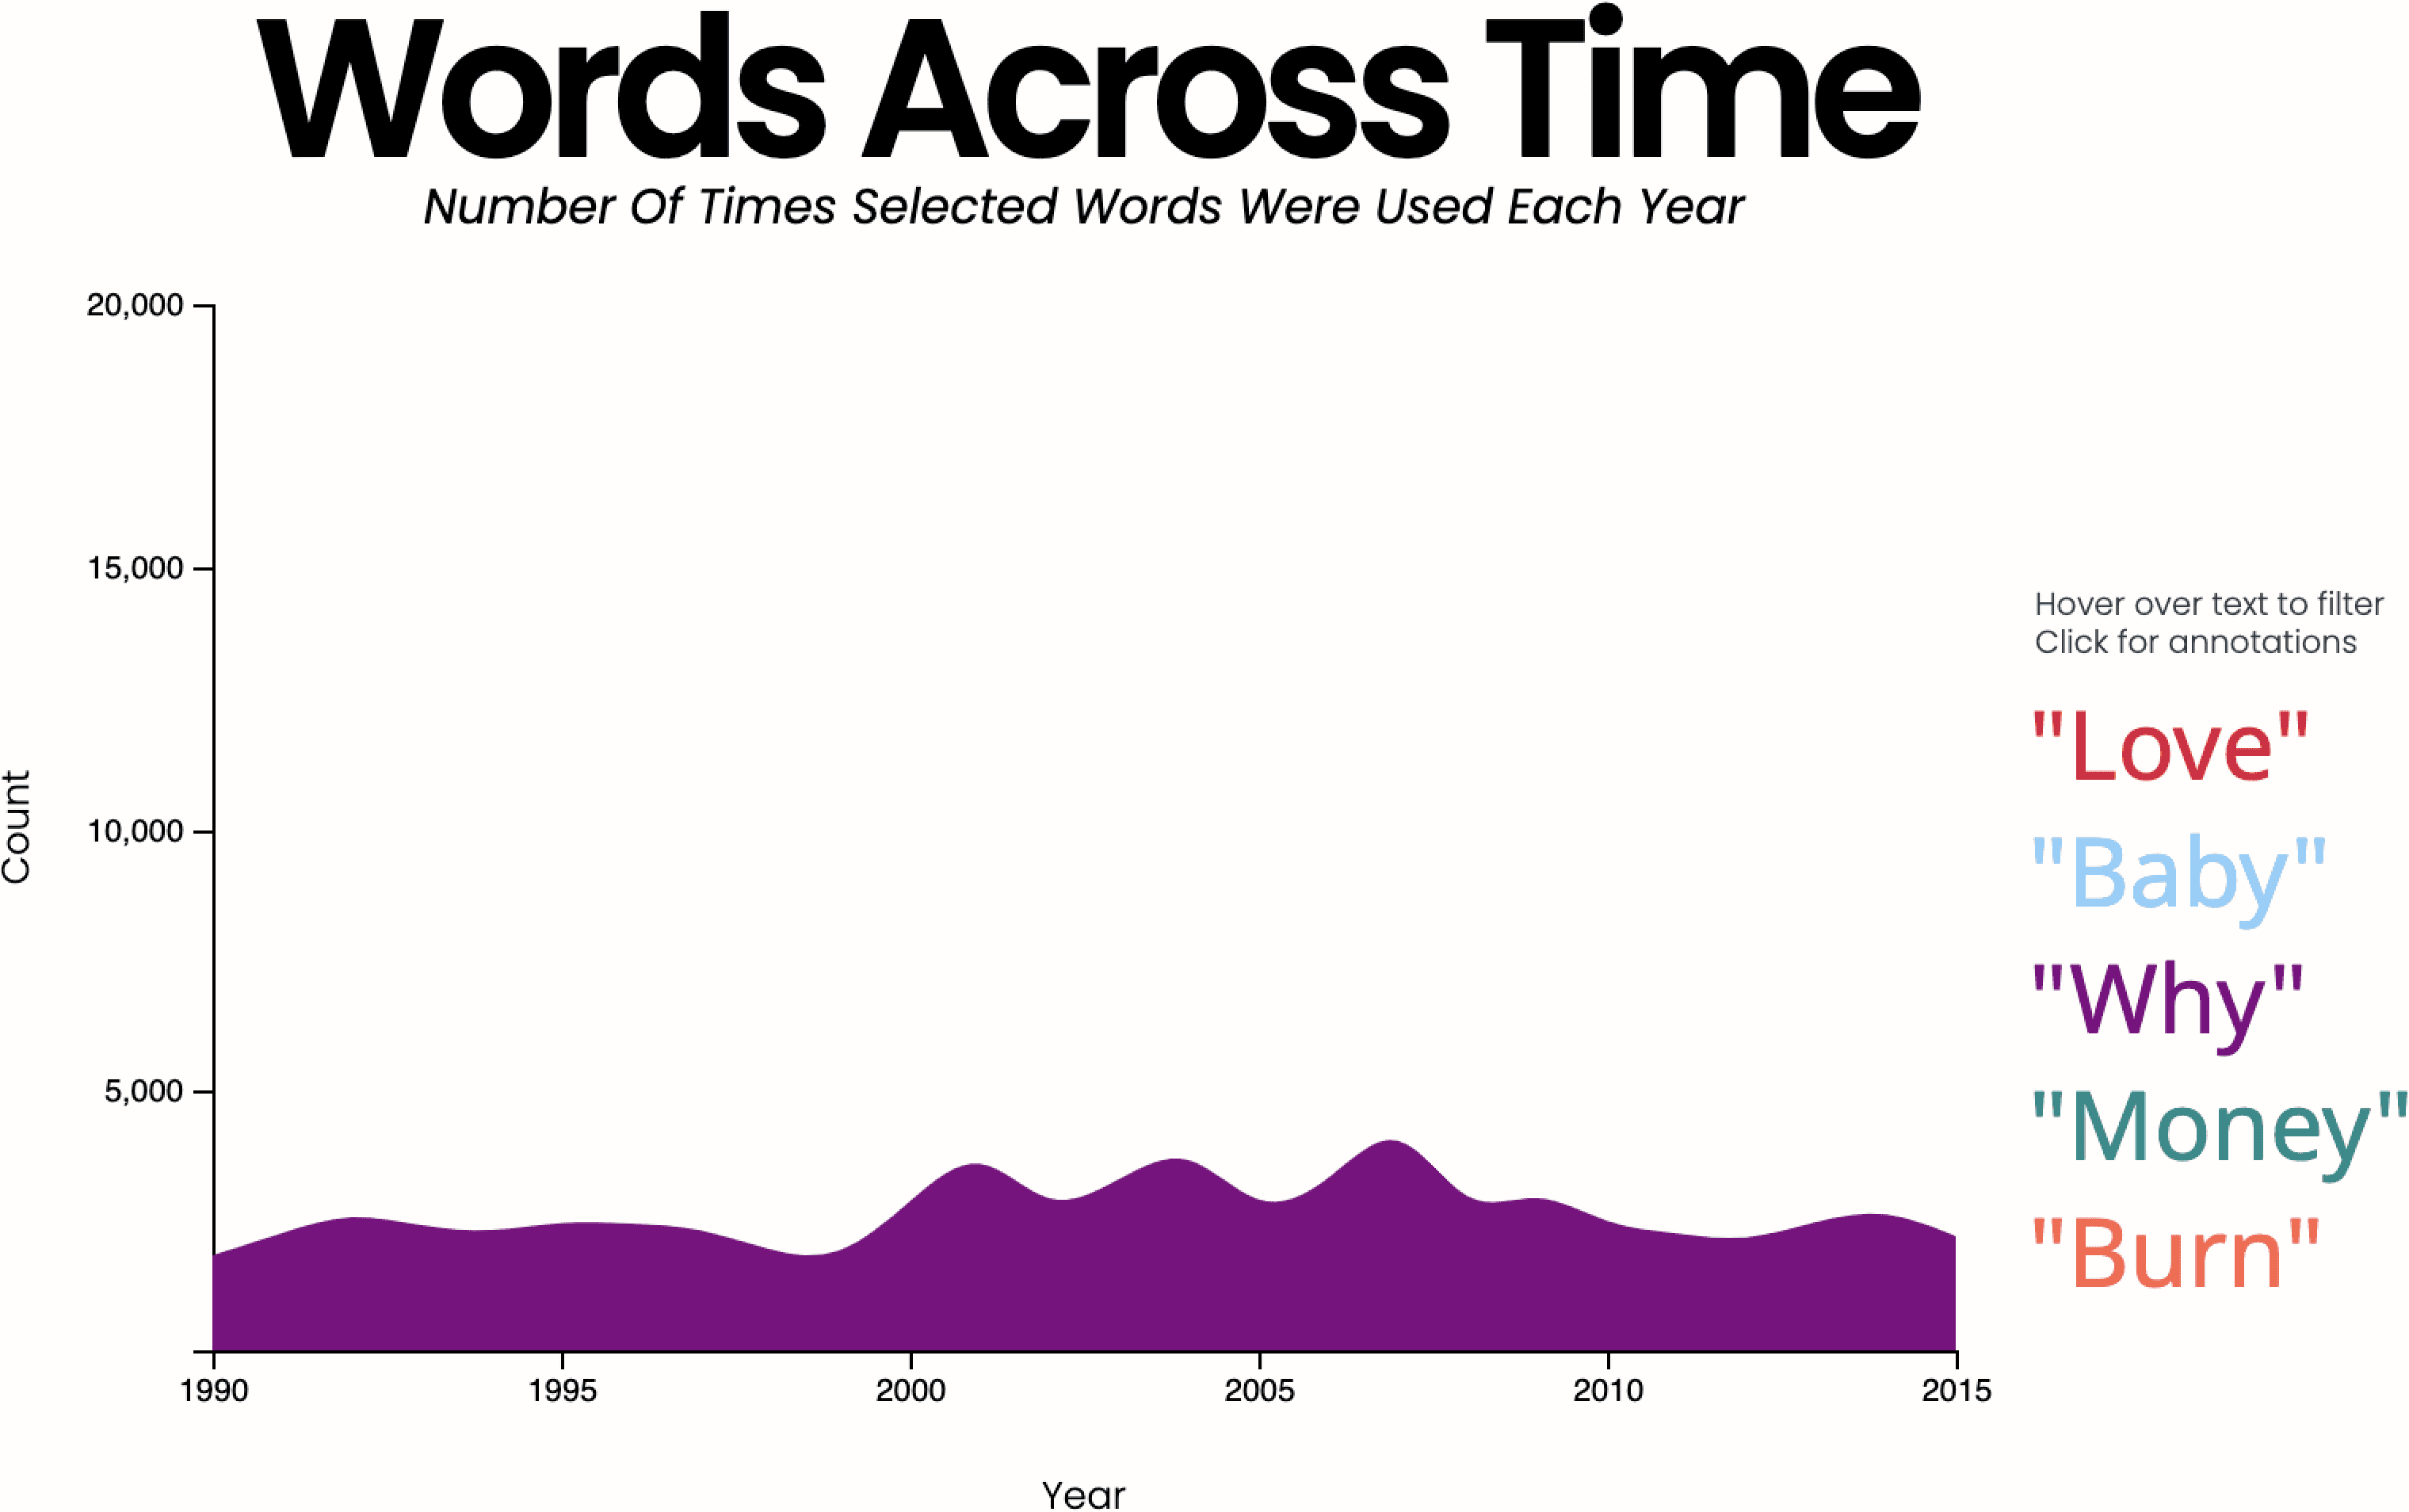
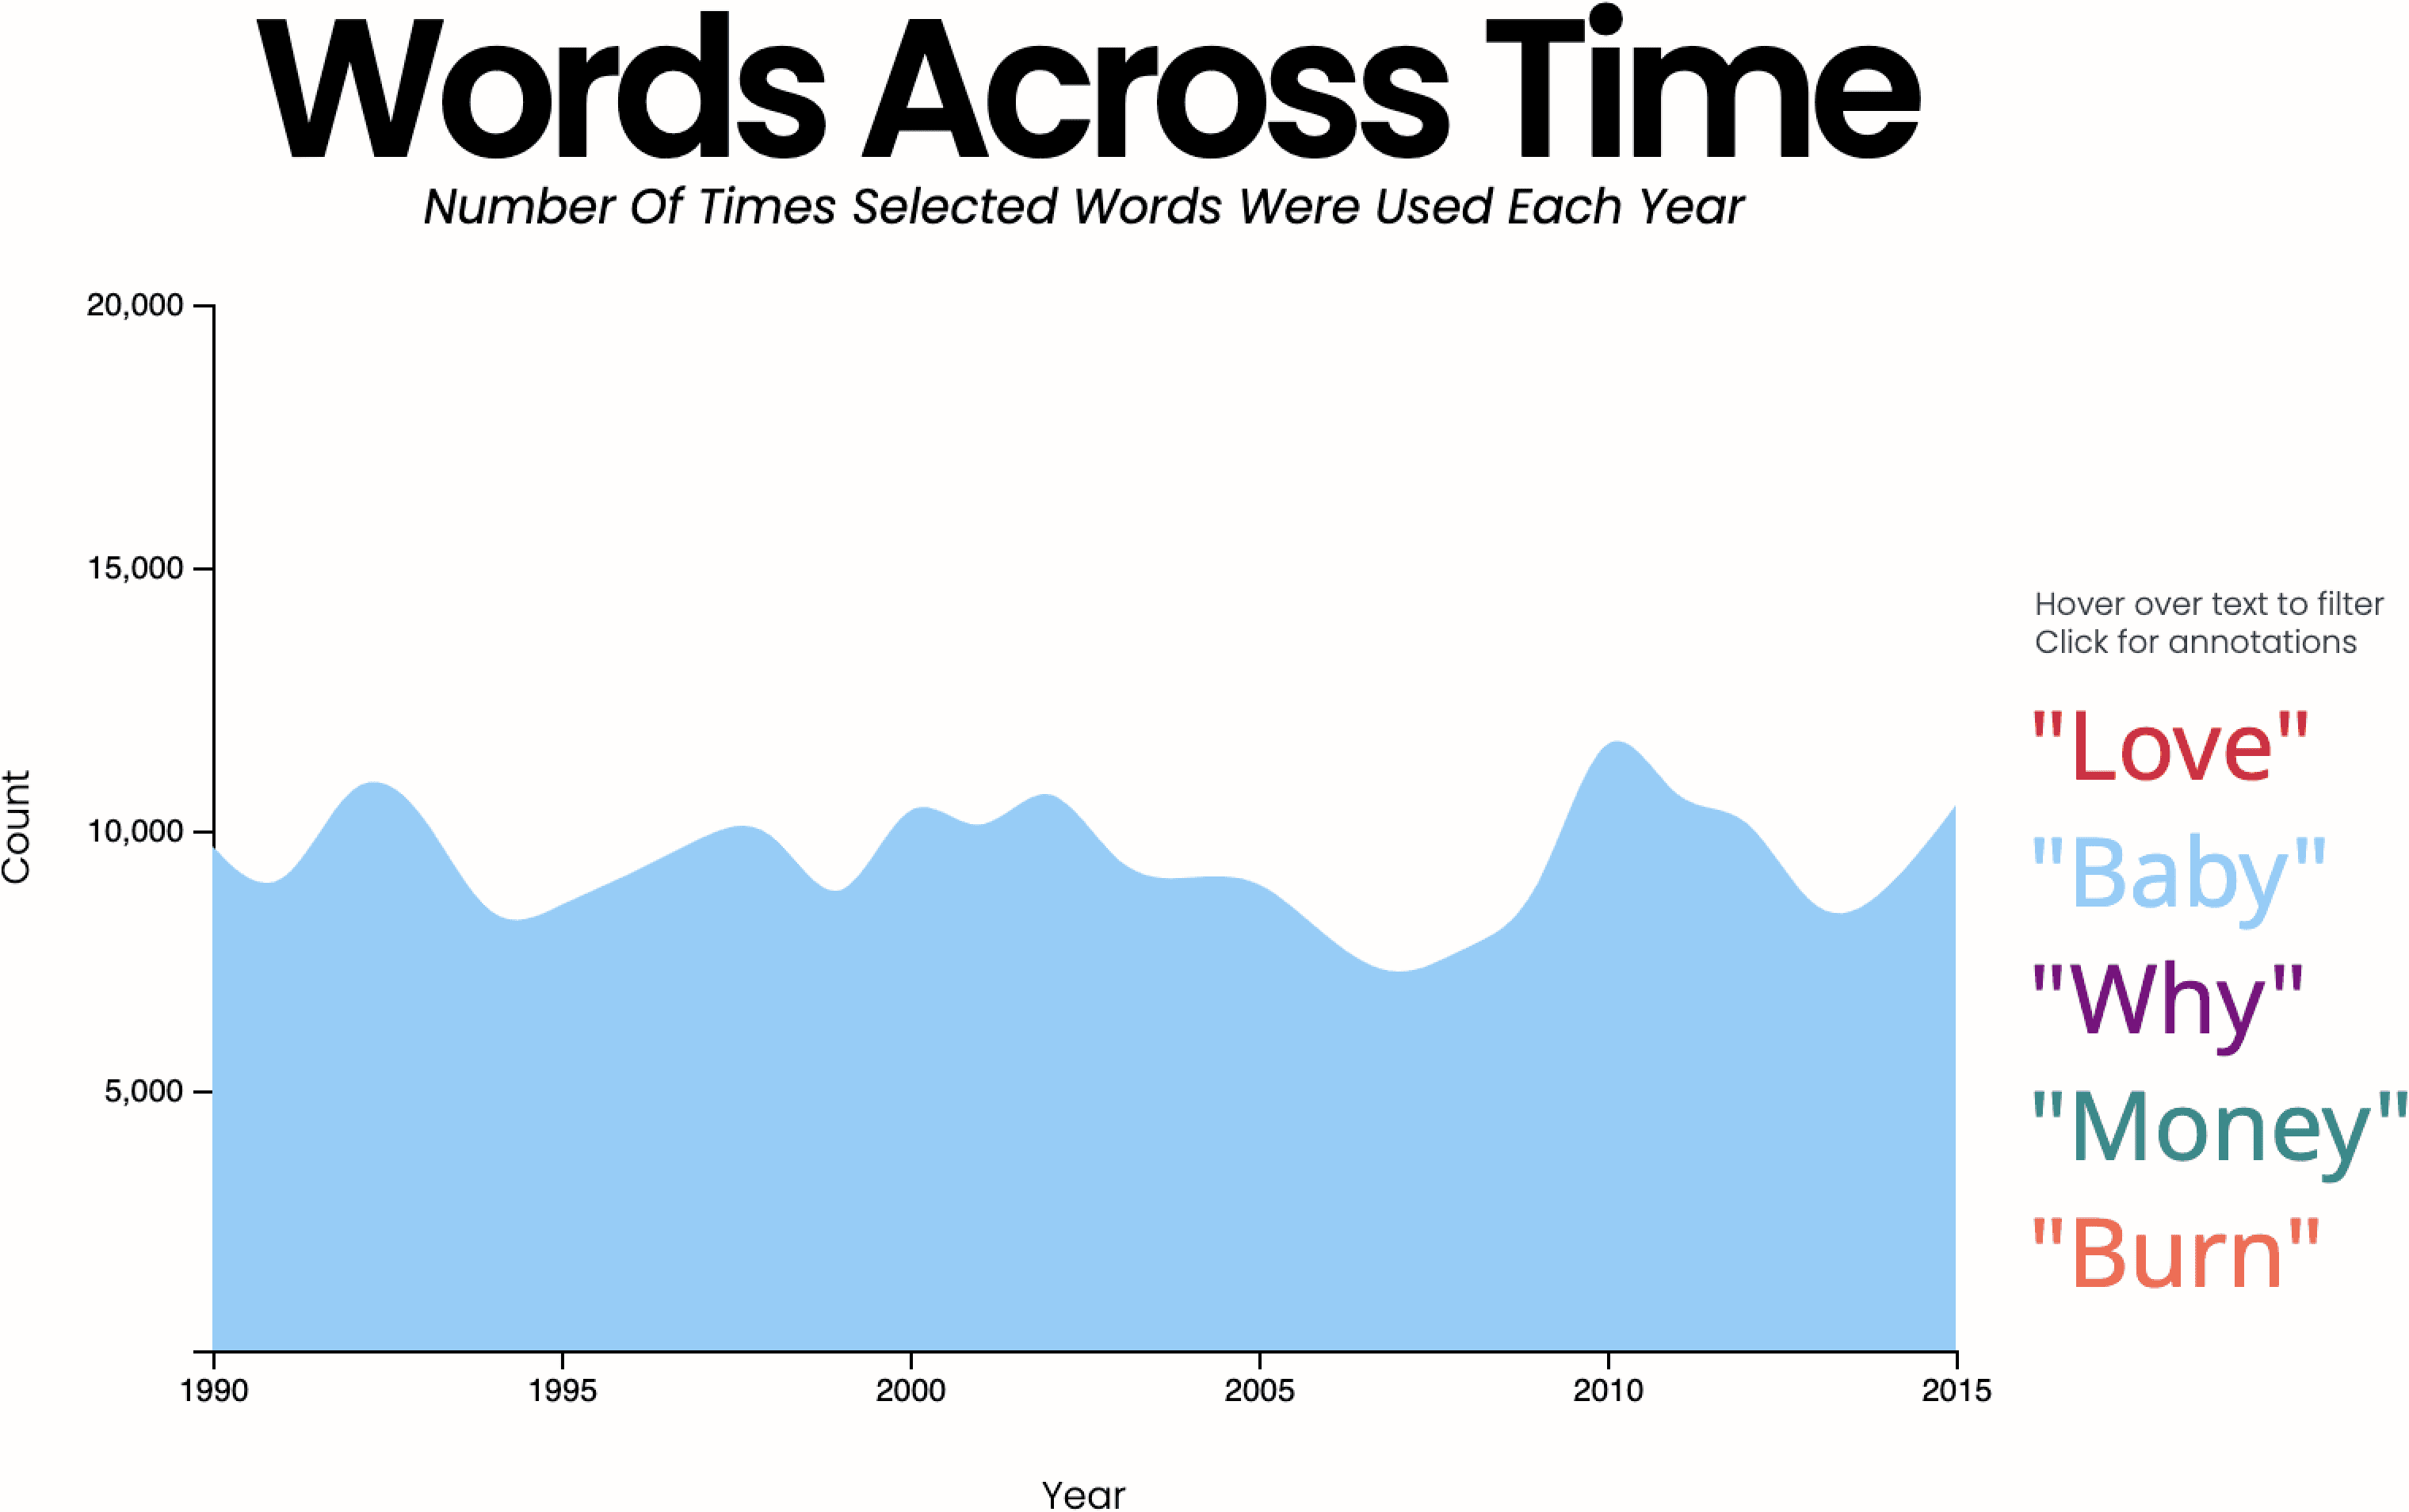
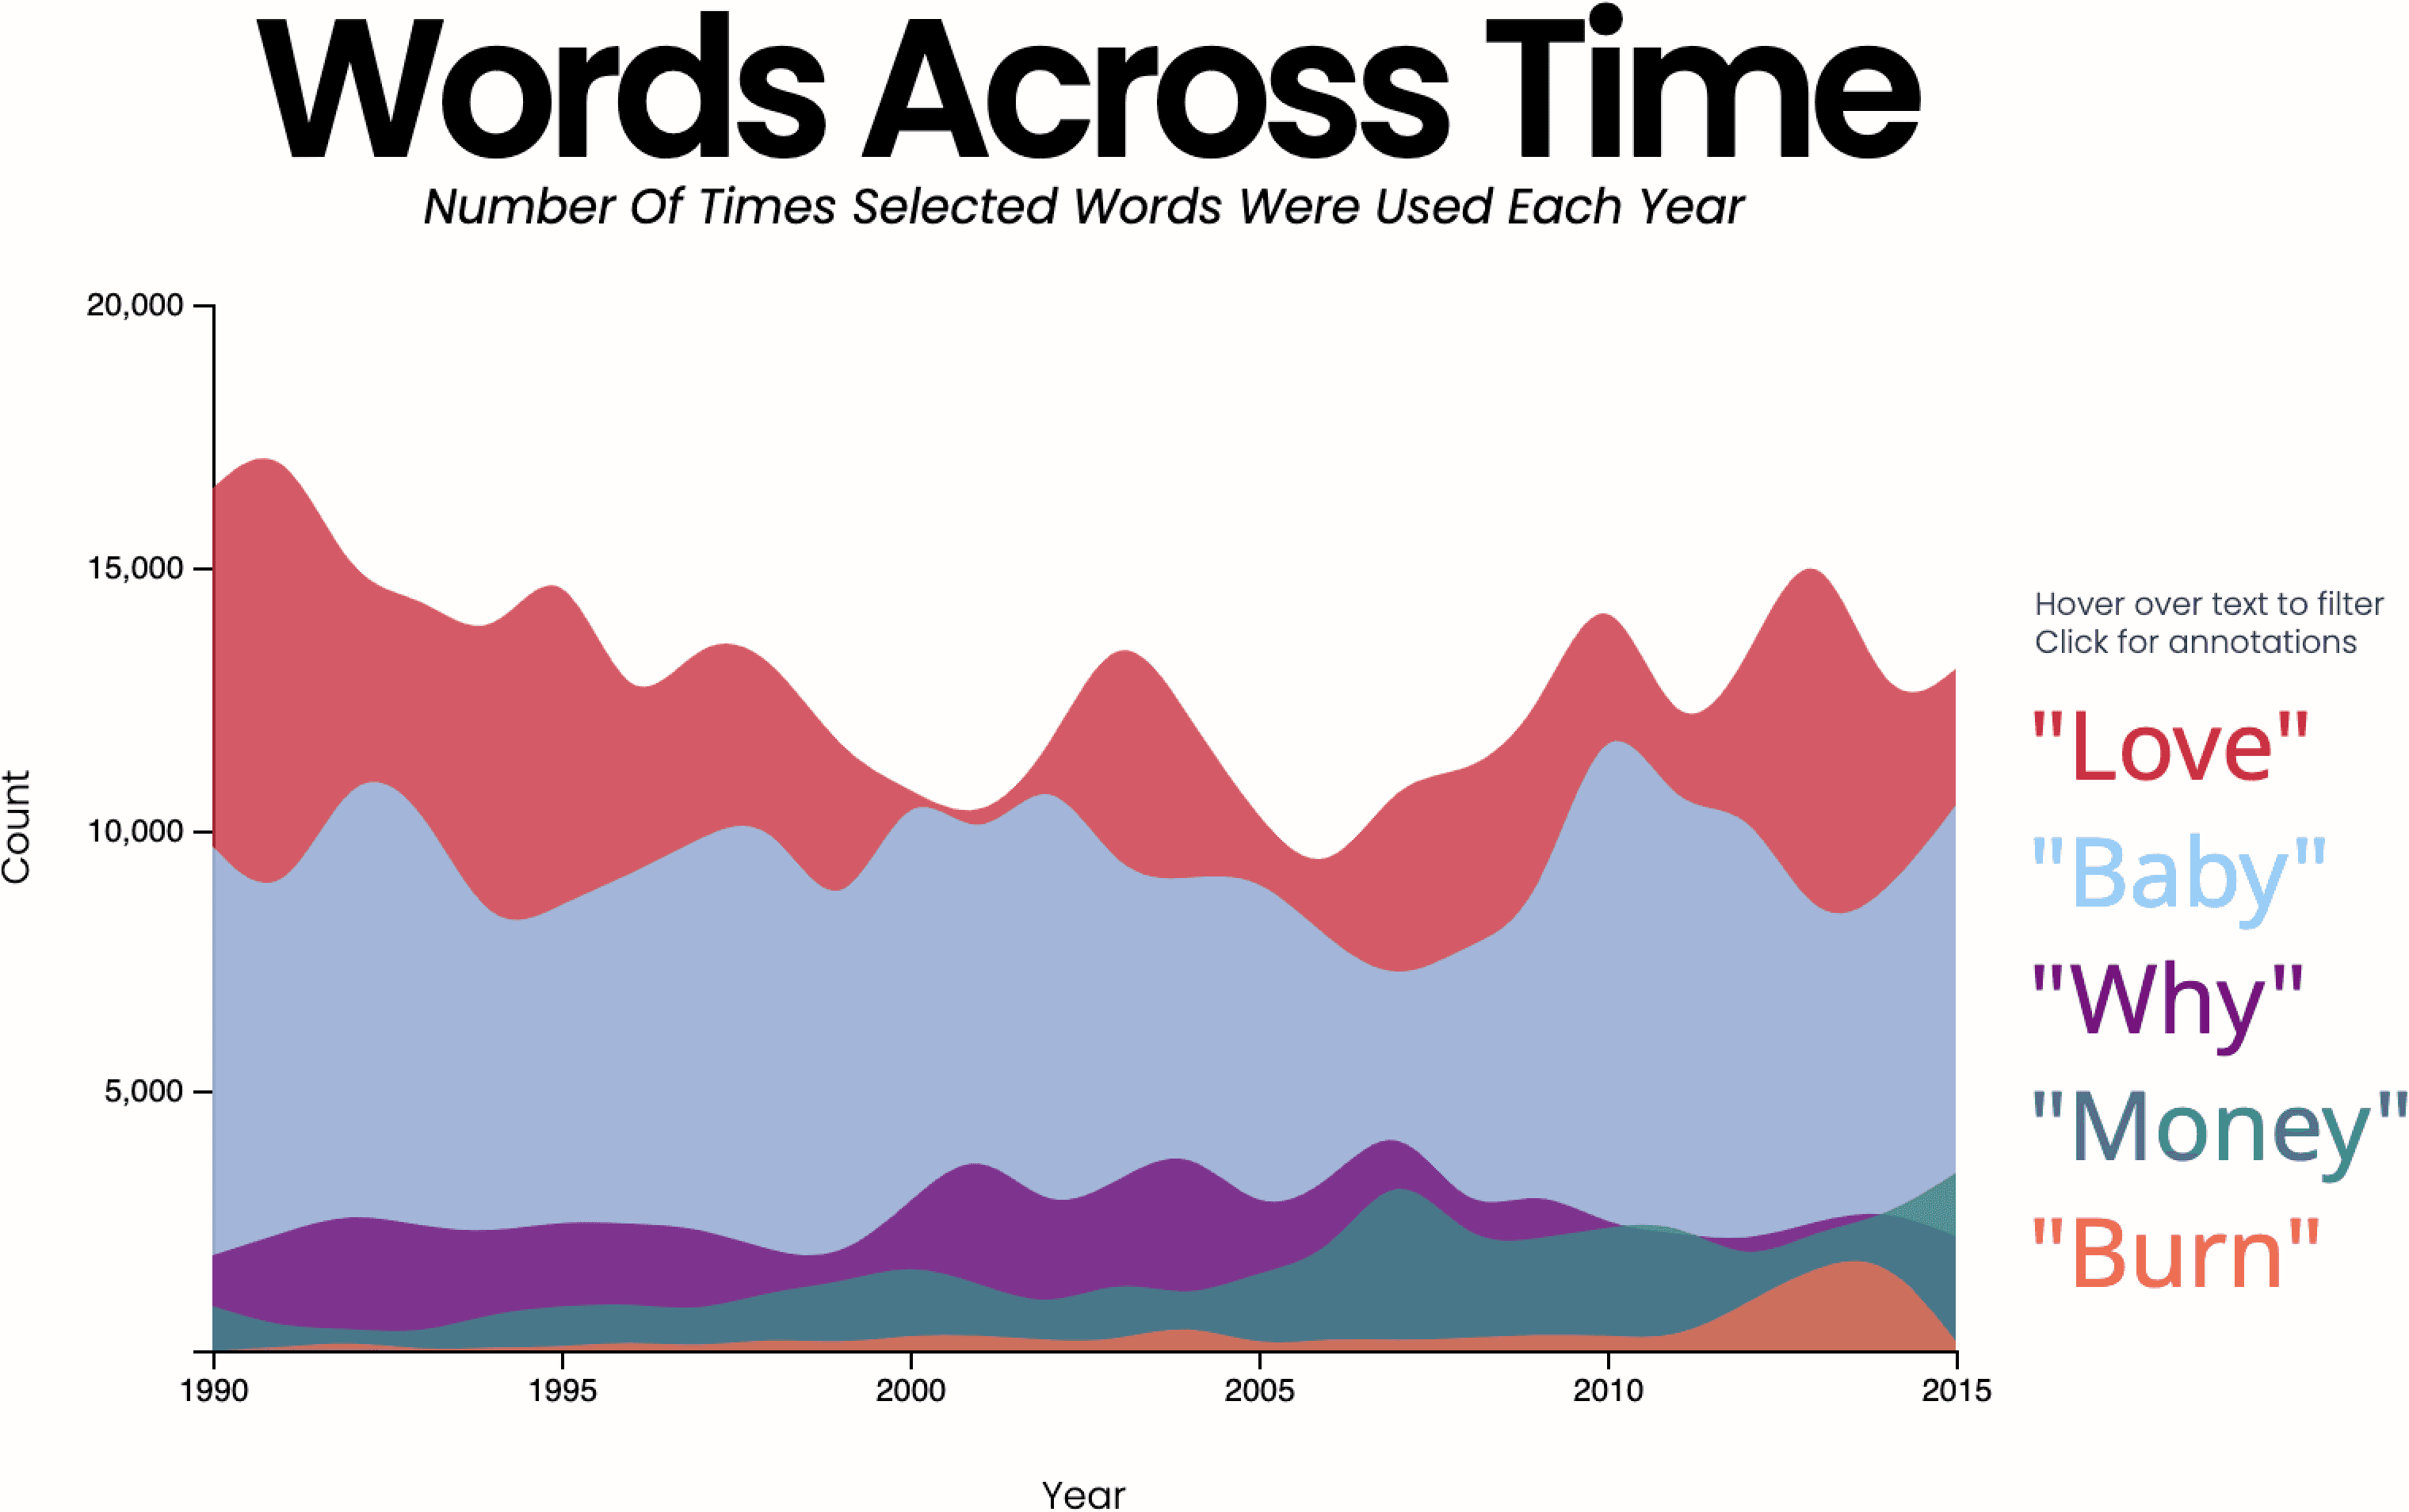
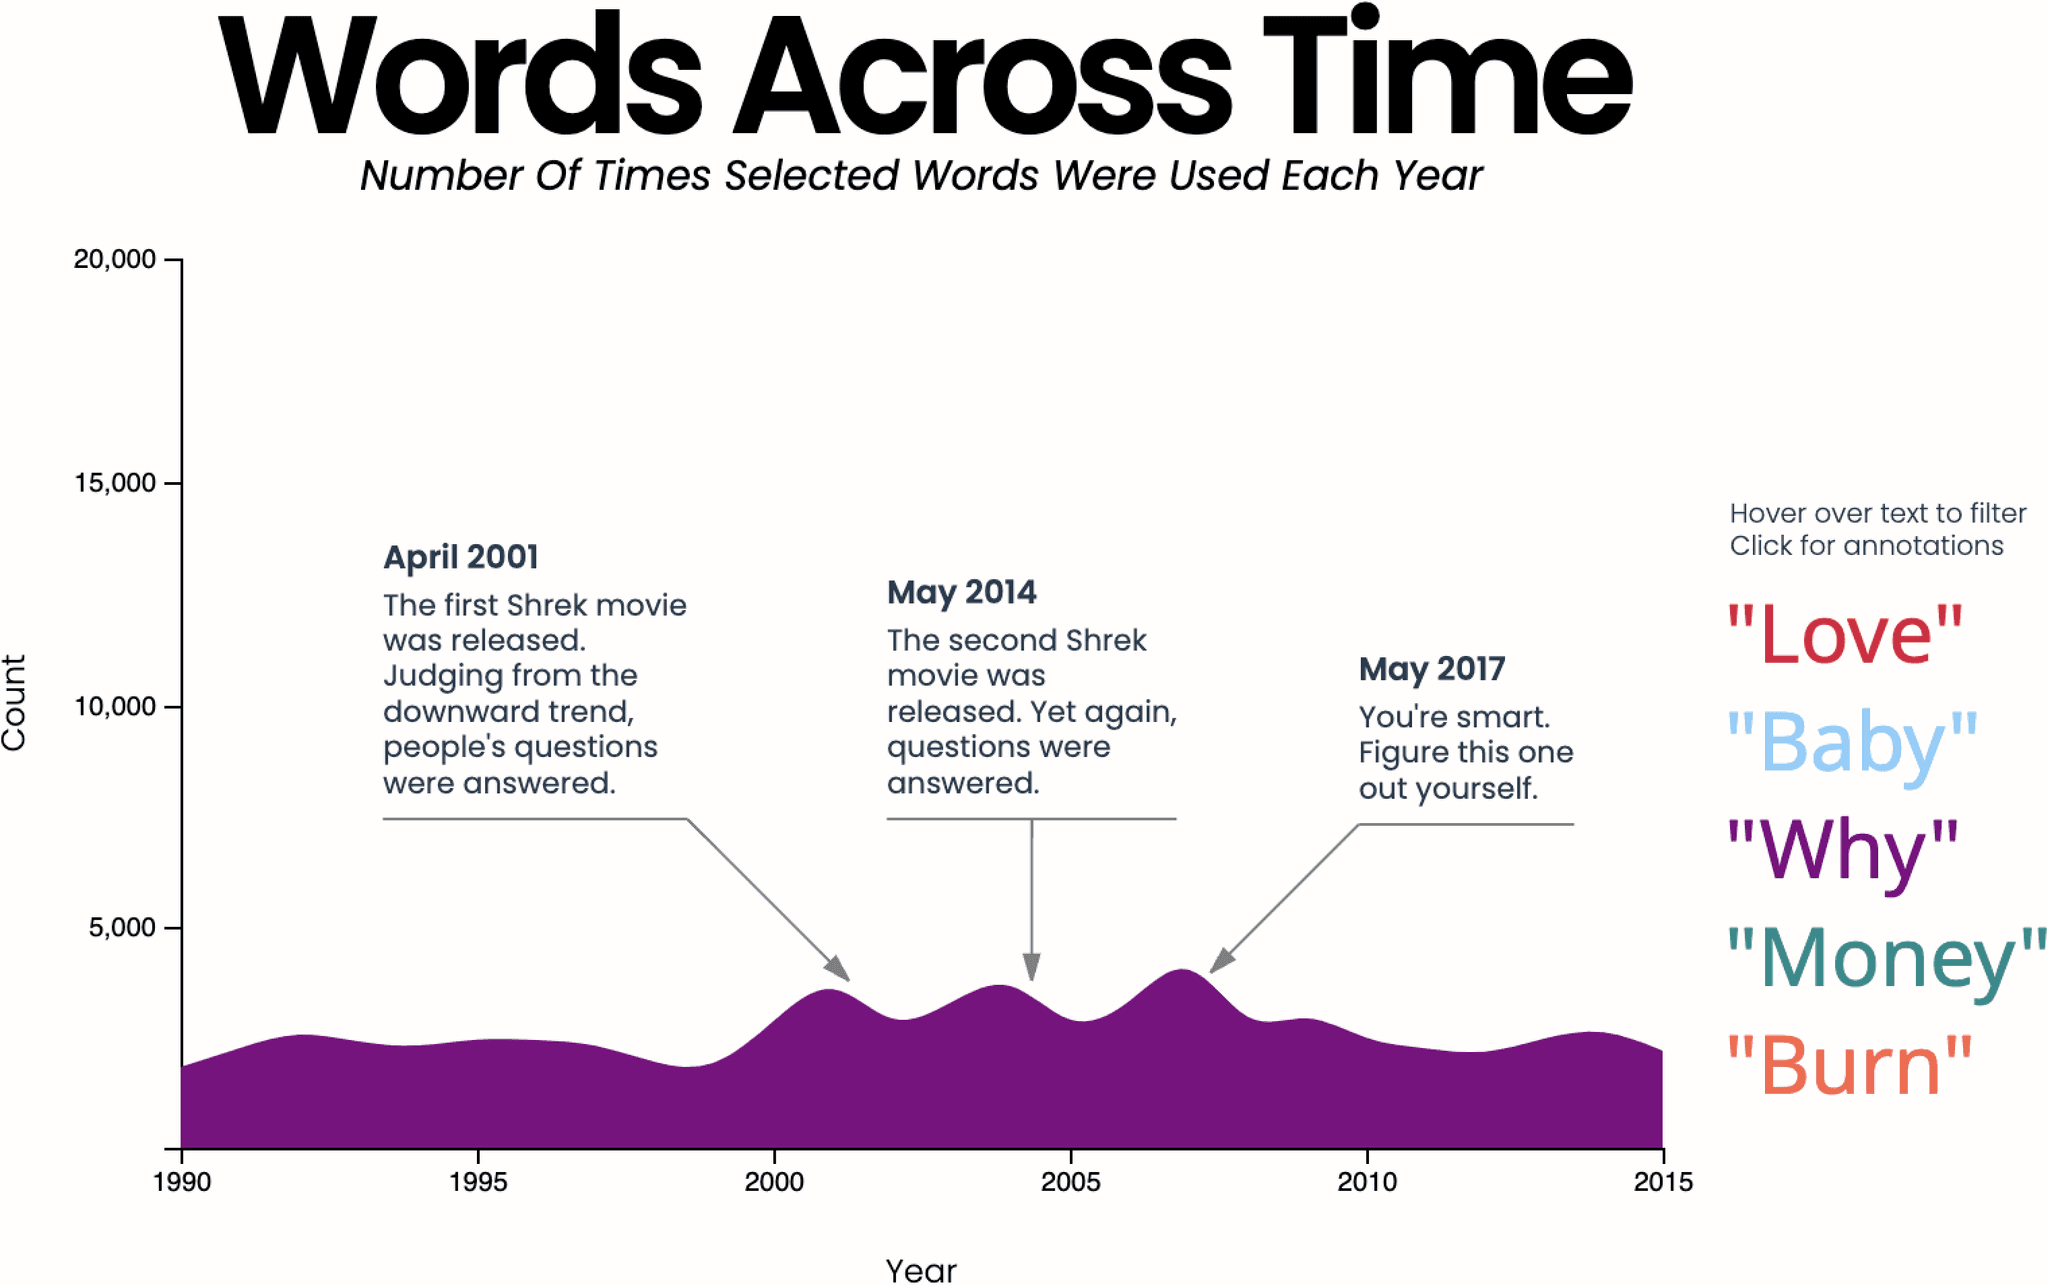
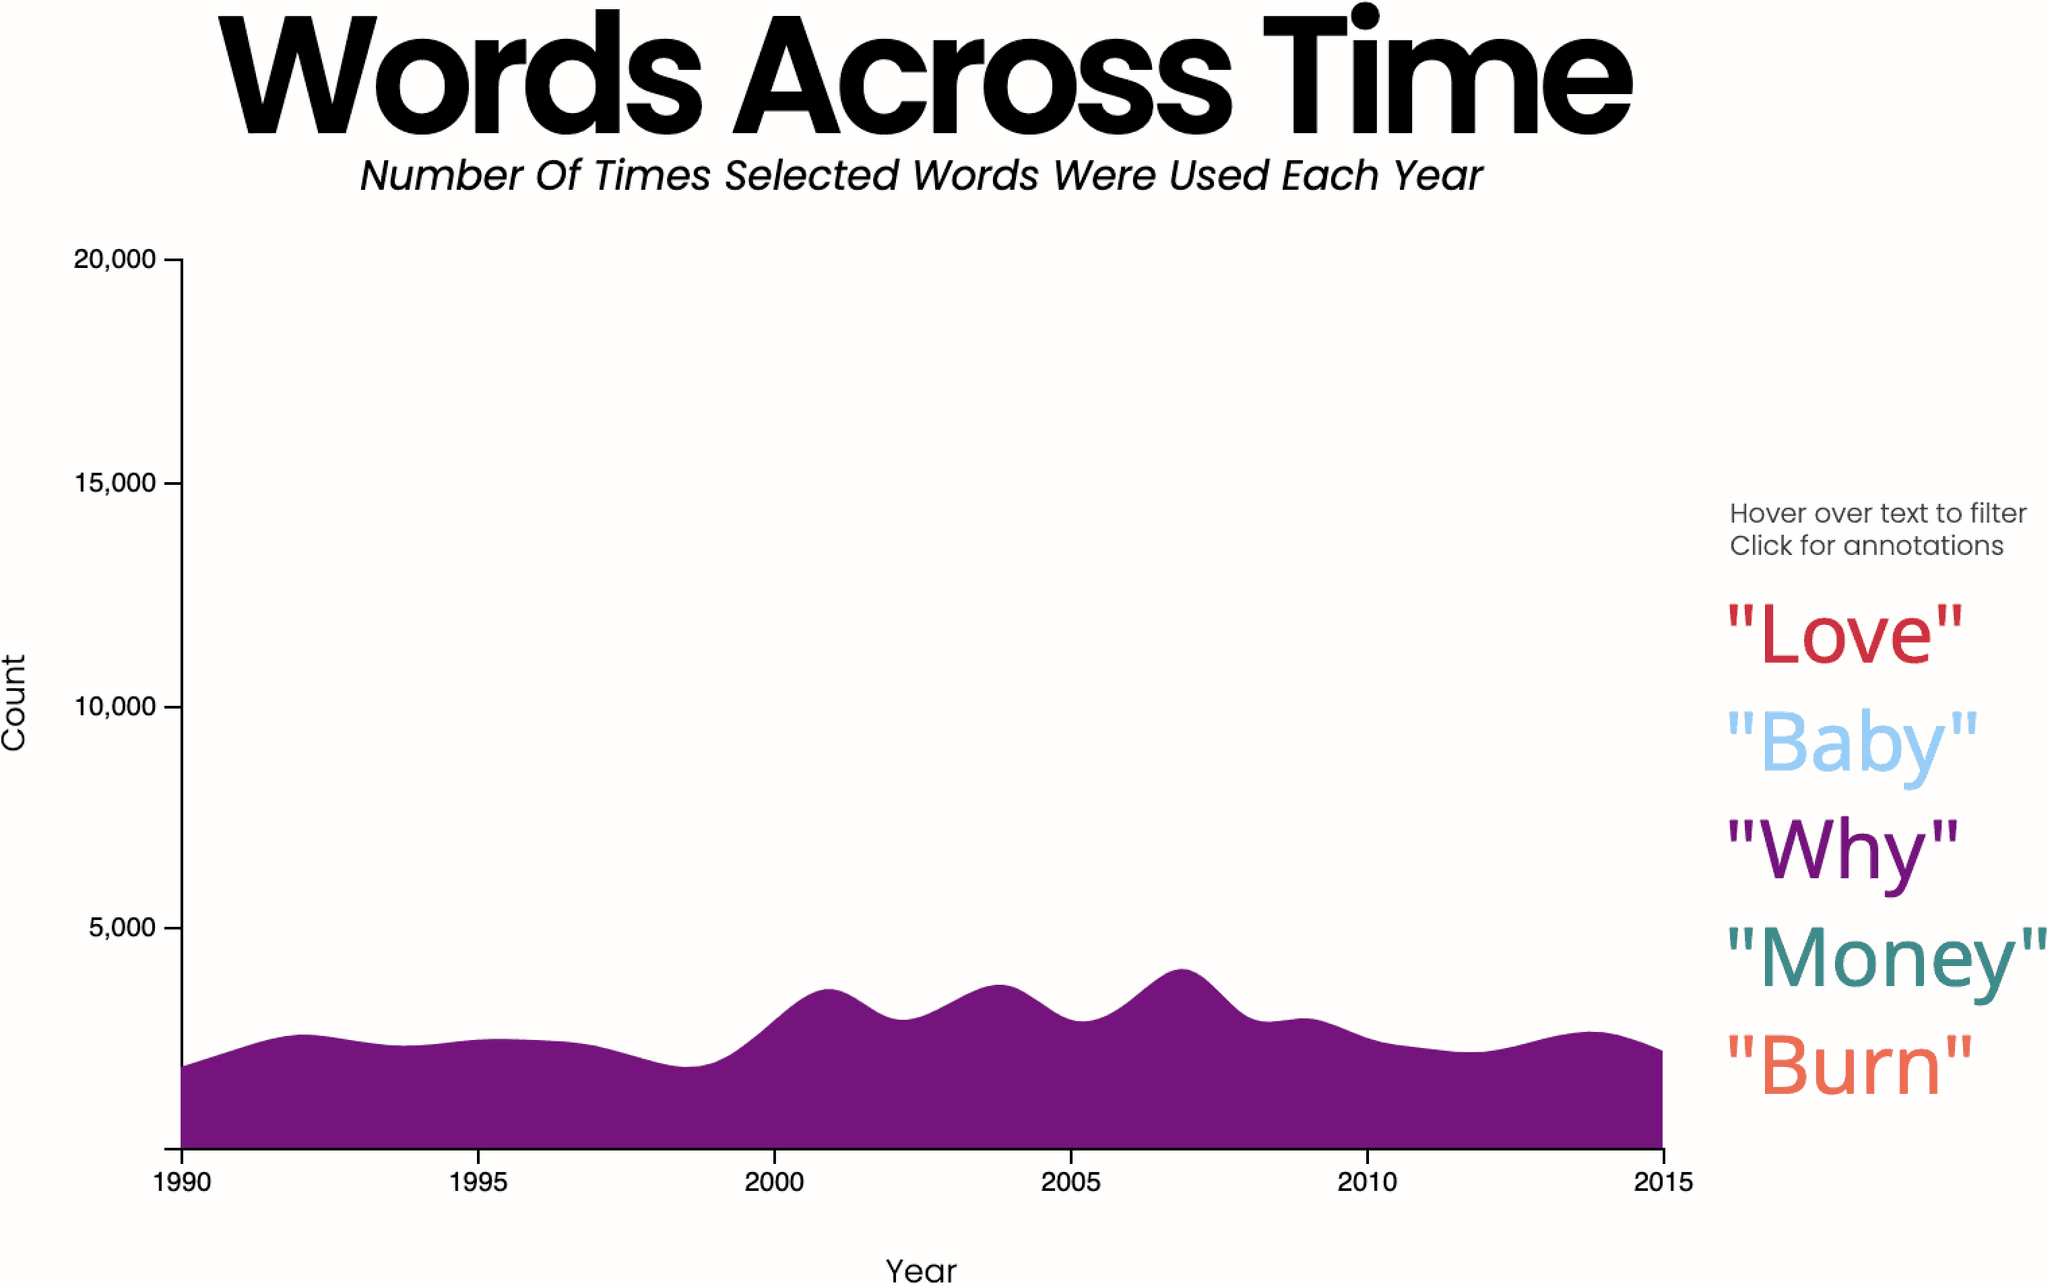
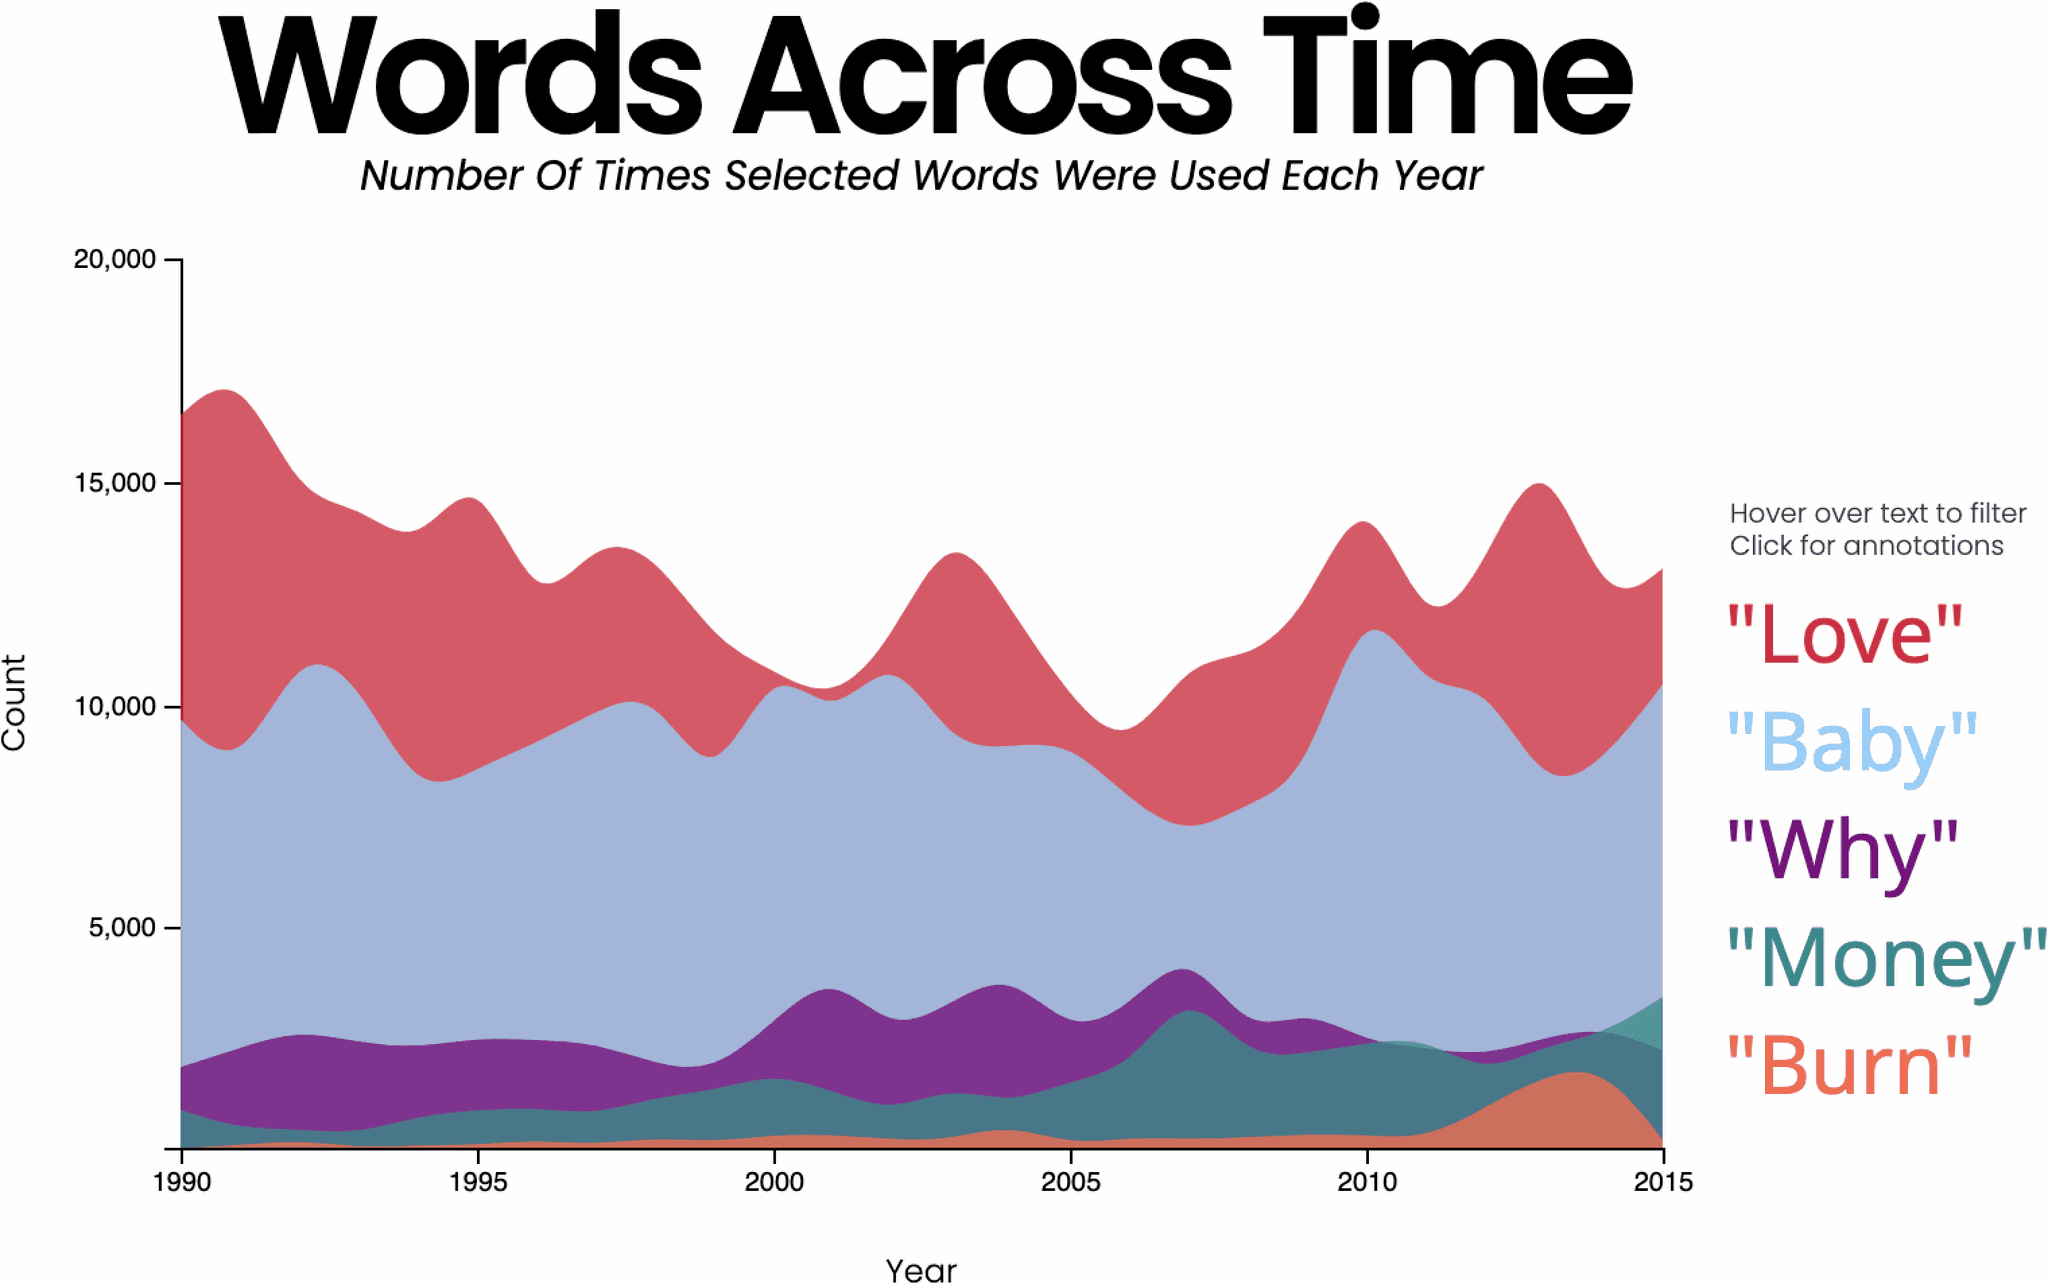
Has the usage of certain words changed over time?
Has the usage of certain words changed over time?
We chose specific words and charted their usage, wondering if there were any trends that would shed light on the cultural landscape of the time.
We chose specific words and charted their usage, wondering if there were any trends that would shed light on the cultural landscape of the time.



Final Thoughts
Final Thoughts
The goal was to have fun with data visualisation and storytelling, and we had a ball.
If we had to be serious about this, we would have approached the analysis with more rigour. Let's take the vocabulary visualisation for example: Instead of simply visualising the number unique words in each song, I would have also grouped them by year, created a box plot, added some jitter to each discrete observation, and colour coded them by genre. I might also have thrown in songs that didn't make the Hot 100 to investigate if it was just the lyrics of popular songs that had gotten simpler.
But what would’ve been the fun in that?